Heatmaps and Timelines: Rethinking Sponsorship Reports
Introduction
In today’s sponsorship economy, brands invest millions to secure visibility in high-profile events — whether on stadium boards, athlete kits, or televised broadcasts. Yet despite this scale of investment, the reporting behind sponsorship exposure often remains surprisingly one-dimensional. Traditional metrics usually reduce performance to a handful of numbers: total impressions, estimated audience size, or average duration of visibility. While these figures provide a baseline, they fail to capture the nuances of where and when a logo actually appears during a match or broadcast.
For senior decision-makers, this lack of precision creates a strategic blind spot. If a brand’s logo is displayed during a key goal moment, its impact is not equal to exposure in a quiet corner of the field during downtime. Executives need more than impression counts — they require insights that show how visibility aligns with moments of high emotional engagement and audience attention. Without this, marketers cannot effectively benchmark sponsorship value, justify costs, or design placement strategies that outperform competitors.
Advances in computer vision and artificial intelligence are changing this picture. By analyzing broadcasts frame by frame, AI can identify logos, measure their screen presence, and map visibility across both space and time. The result is a new generation of reporting tools: heatmaps that show where on screen the logo appeared, exposure curves that track visibility second by second, and timelines that reveal how exposure coincides with the most important moments of a match.
This transformation shifts sponsorship analysis from static, backward-looking reports into dynamic, visual intelligence that executives can use to make faster, evidence-based decisions. Instead of relying on broad estimates, sponsorship teams can now present stakeholders with data that directly connects exposure to context, attention, and brand impact. For C-level leaders, this means clarity, accountability, and the ability to allocate budgets with far greater confidence.
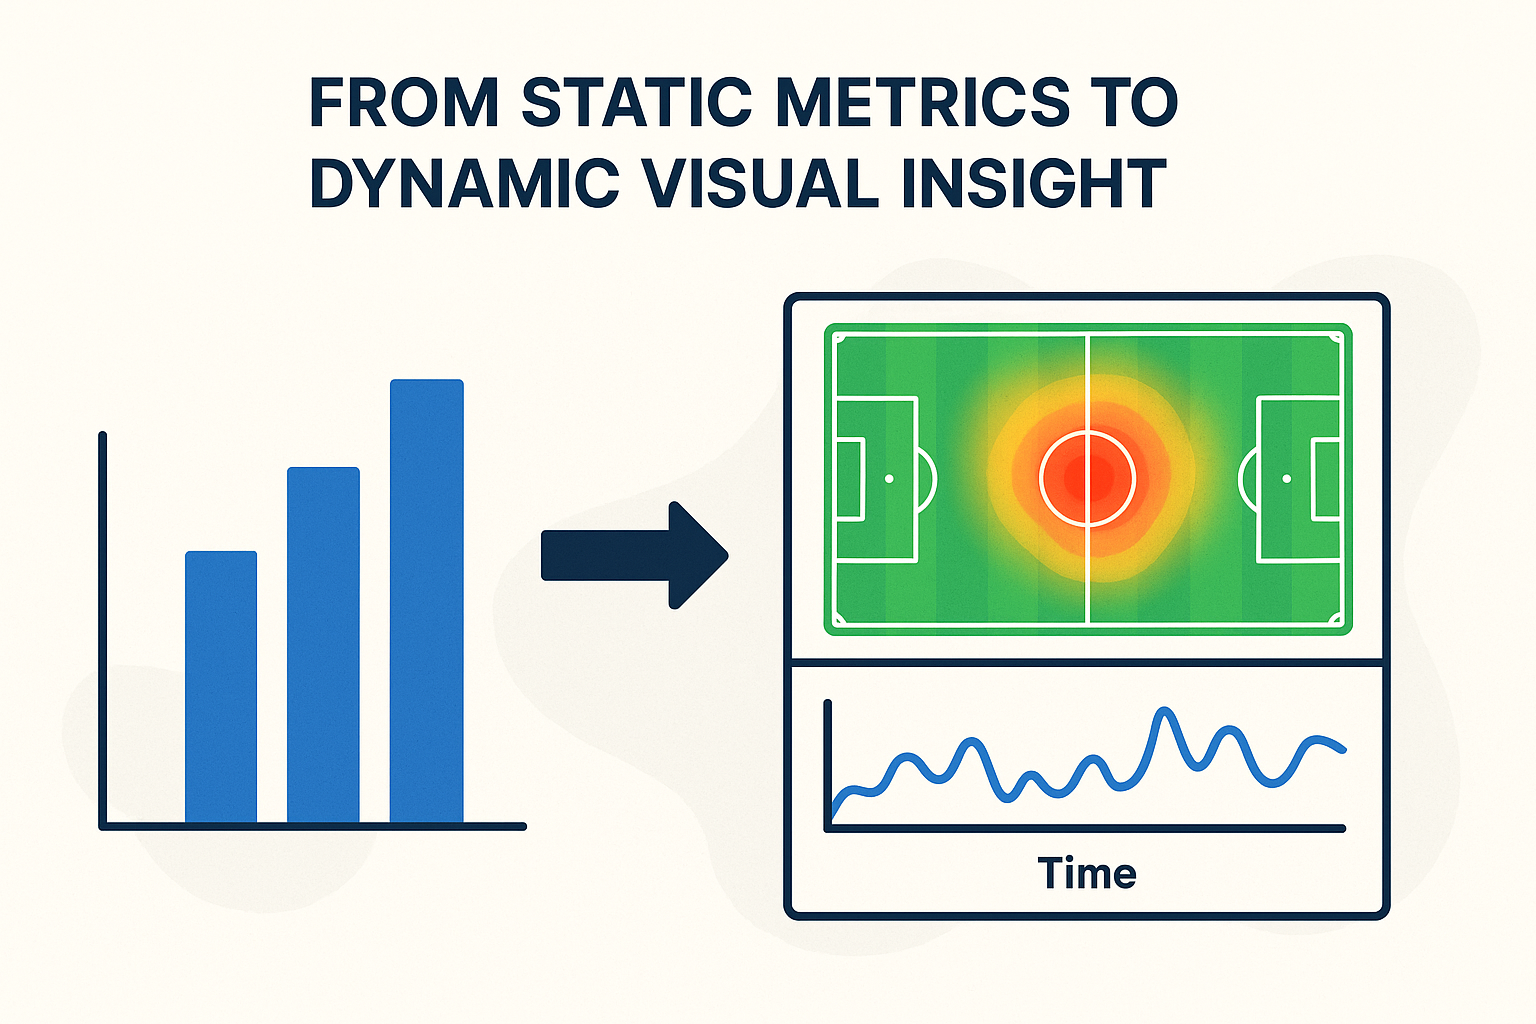
From Static Metrics to Dynamic Visual Insight
For decades, sponsorship reporting has relied on aggregate numbers. A post-event report might summarize that a logo was “visible for 15 minutes” or “reached an audience of 20 million viewers.” While such figures create a veneer of accountability, they rarely tell the full story. Visibility without context is a blunt metric — it does not explain whether the logo appeared in a prominent position, whether it coincided with high-impact moments, or whether viewers actually noticed it.
This static approach leaves executives with an incomplete view. It is the equivalent of knowing the total sales volume without understanding which products, regions, or customer segments drove it. For leaders tasked with allocating marketing budgets and negotiating sponsorship contracts, this lack of granularity weakens the ability to make evidence-based decisions.
Dynamic visual insights address this gap by bringing sponsorship reporting closer to how audiences actually experience events. Heatmaps reveal the precise on-screen positions where a logo was displayed — highlighting whether it was front-and-center during critical plays or relegated to the background. Exposure curves translate visibility into a temporal pattern, showing when attention peaked, when it dipped, and how those fluctuations aligned with the flow of the match. And by adding second-by-second analysis, marketers can link exposure directly to the emotional arc of the audience, isolating the moments that matter most.
For C-level executives, these tools change the nature of sponsorship evaluation. Instead of relying on static summaries, leaders gain access to interactive, visually intuitive insights that can be compared across campaigns, events, and platforms. This empowers sponsorship teams to answer questions that truly matter to the boardroom:
Did our investment deliver visibility during the most watched moments?
Which placements consistently outperform in terms of attention?
How do we benchmark against competitors who shared the same stage?
Dynamic reporting is not just a technical improvement; it is a strategic shift. It transforms sponsorship from an expense to be justified into an asset that can be measured, optimized, and strategically deployed. For executives under pressure to maximize marketing efficiency, this evolution offers a clearer path to demonstrating return on investment and shaping more effective sponsorship strategies.
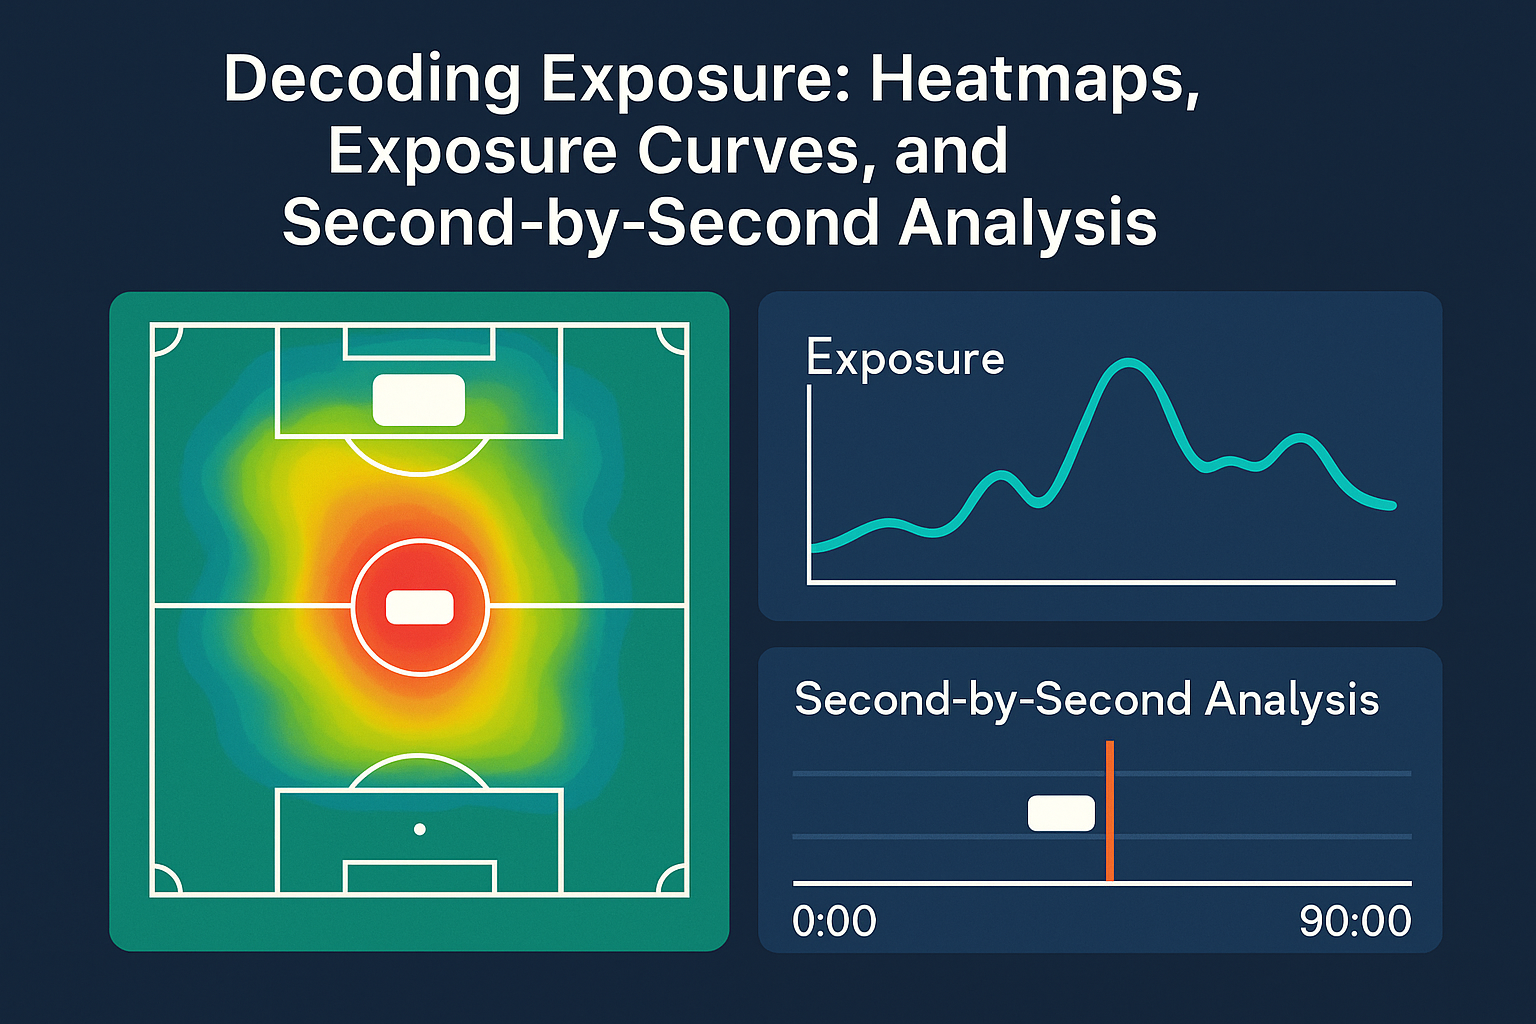
Decoding Exposure: Heatmaps, Exposure Curves, and Second-by-Second Analysis
Executives today demand more than broad visibility statistics; they want sponsorship reports that translate into actionable intelligence. This is where modern analytics tools — heatmaps, exposure curves, and second-by-second timelines — bring sponsorship data to life. Each element provides a unique lens on brand presence, and together they build a comprehensive picture of impact.
Heatmaps: Where the Logo Lives on Screen
Heatmaps are spatial analytics in their most intuitive form. They aggregate all instances of a logo and display them as intensity maps across the broadcast frame. This makes it immediately clear whether the brand dominated prime viewing zones — like the center of the screen during goal replays — or was mostly confined to peripheral areas with lower audience attention. For executives, heatmaps cut through the complexity of raw data, offering an at-a-glance confirmation of sponsorship effectiveness.
Exposure Curves: How Visibility Evolves Over Time
Beyond static positions, exposure curves reveal the rhythm of logo visibility. By plotting screen time across the duration of an event, these curves highlight patterns: spikes during decisive plays, steady exposure from static placements, or unexpected drops due to camera angles. Executives can use these insights to evaluate not just how long a logo was visible, but whether that visibility aligned with emotionally charged moments when audience engagement was at its peak.
Second-by-Second Analysis: Precision at Match Speed
When every second of broadcast time carries value, granular analysis becomes essential. Second-by-second breakdowns pinpoint exactly when exposure occurred, down to the moment. Was the logo visible during the final whistle? Did it appear in the background as players celebrated? Such precision enables sponsorship teams to match brand presence with audience sentiment, transforming exposure from a general measure into a contextualized, high-value asset.
Why It Matters for Leaders
For C-level executives, these tools provide clarity at both strategic and tactical levels. Strategically, they support benchmarking across events, leagues, and sponsorship packages. Tactically, they help optimize placement strategies for future negotiations — ensuring investment is directed toward formats that consistently deliver impact. Instead of debating abstract numbers, leadership teams can now ground sponsorship discussions in concrete visual evidence.
This multidimensional view of exposure is a significant leap forward from legacy reporting. By integrating heatmaps, exposure curves, and second-by-second timelines, organizations can finally measure sponsorship effectiveness with the same rigor applied to digital advertising or performance marketing. The result is sponsorship intelligence that is not only measurable but also strategically actionable.

Strategic Value for Marketing and Sponsorship Planning
For executives responsible for marketing budgets, sponsorship is not just about visibility — it is about measurable business outcomes. The challenge has always been proving that brand exposure during live events directly contributes to awareness, preference, and ultimately, revenue. Traditional reporting, with its static and aggregated figures, often falls short of answering this fundamental question. Dynamic analytics built on heatmaps, exposure curves, and second-by-second timelines change the equation, enabling leaders to connect sponsorship investments to strategic business goals with far greater confidence.
Benchmarking Across Campaigns and Competitors
Executives need clarity on whether a particular sponsorship is outperforming or underperforming against industry standards. With spatial and temporal visibility data, marketers can benchmark across different matches, events, or even rival brands. For example, a heatmap can reveal that a competitor consistently secures more central on-screen placement, while exposure curves can prove that their visibility peaks during decisive moments. This intelligence transforms competitive analysis from guesswork into data-driven strategy.
Optimizing Placement Strategies
Not all placements deliver equal value. A logo on a static sideline board might deliver steady visibility but miss high-impact moments, whereas an animated digital overlay could spike audience attention during key plays. By analyzing second-by-second exposure, executives can identify which placements deliver the strongest return. This allows marketing leaders to negotiate sponsorship contracts with precision — directing investment toward formats, locations, and broadcast conditions that consistently outperform.
Aligning with High-Impact Moments
Sponsorship success is often defined by timing. A logo that appears during a goal celebration or game-deciding moment has far greater emotional resonance than one visible during a lull in play. Exposure curves and timelines enable marketers to track these correlations, ensuring sponsorship strategies are aligned with the emotional heartbeat of the audience. For leaders, this means moving from “was the logo visible?” to “was it visible at the right time, when attention was highest?”
Maximizing ROI and Accountability
Perhaps the greatest strategic value lies in accountability. In a climate where every marketing dollar is scrutinized, executives need to demonstrate measurable outcomes. By adopting advanced exposure analytics, sponsorship teams can report with transparency and precision, building trust with boards, investors, and partners. This evidence-based approach doesn’t just justify current spending — it strengthens the case for future investments by proving clear value creation.
In short, dynamic sponsorship analytics elevate reporting from an operational function to a strategic tool. For C-level leaders, this shift means greater control over outcomes, sharper alignment with organizational goals, and a clear competitive edge in markets where visibility and attention are premium assets.
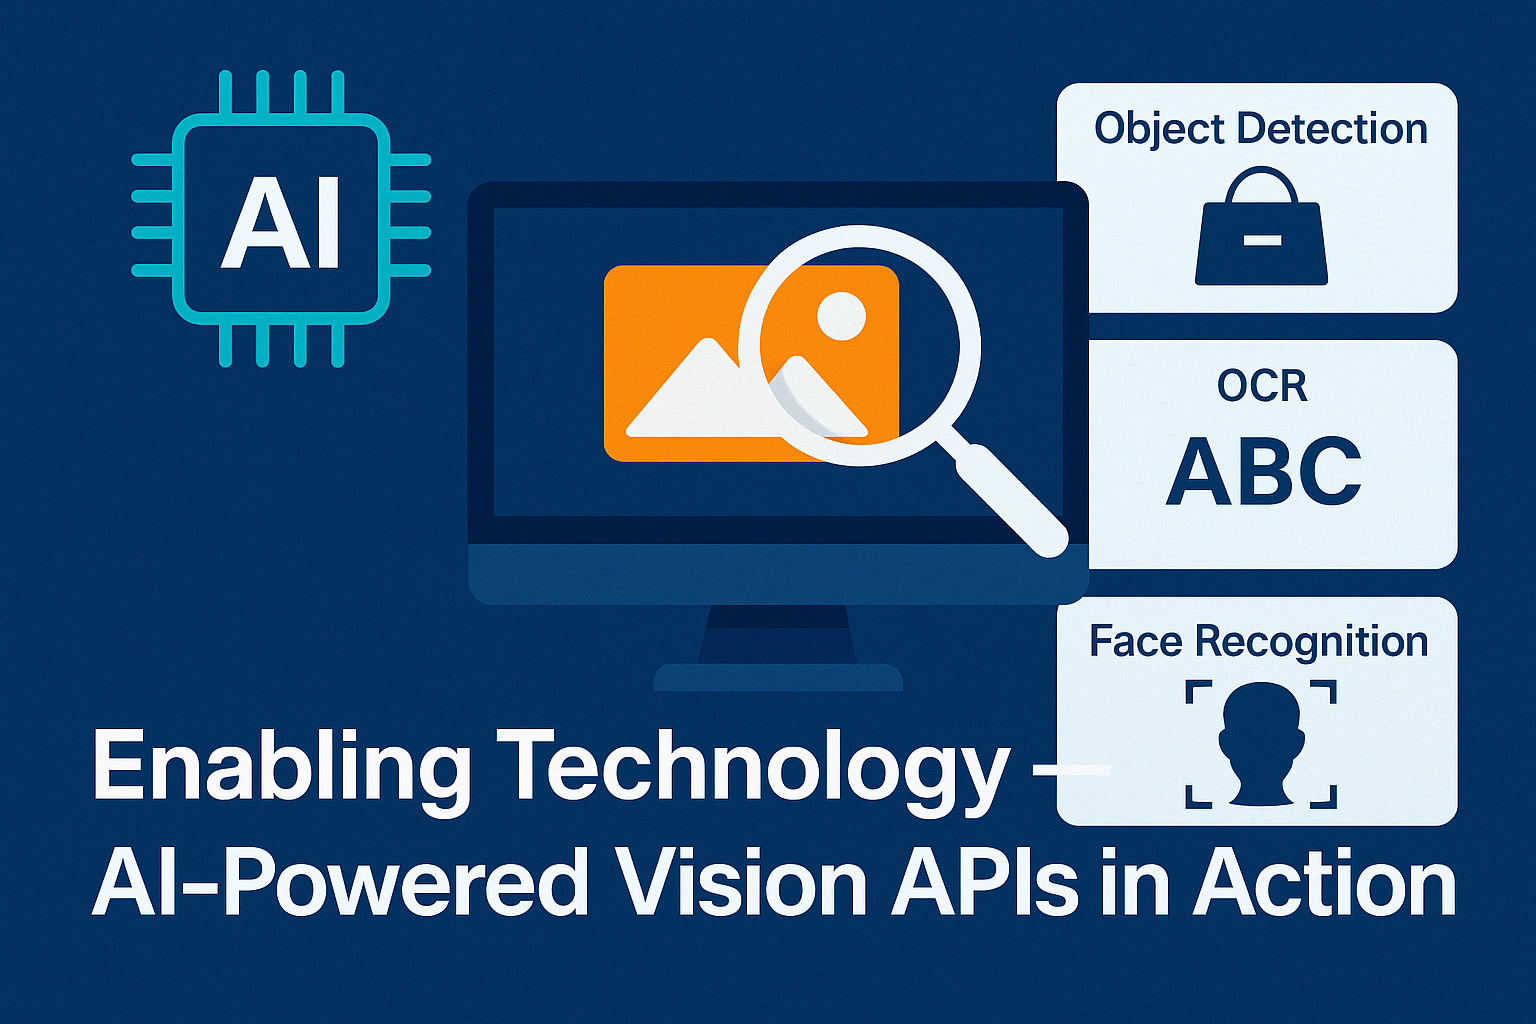
Enabling Technology — AI-Powered Vision APIs in Action
The promise of heatmaps, exposure curves, and second-by-second timelines depends on one critical capability: the ability to detect and measure brand presence automatically, across vast amounts of video data, with accuracy and speed. This is where artificial intelligence, and specifically computer vision powered by cloud APIs, becomes indispensable.
Automated Detection at Scale
Sports broadcasts can generate hundreds of hours of footage across multiple cameras, angles, and formats. Manual review of such content is not only impractical but also prone to inconsistency. AI-powered vision systems analyze video frame by frame, identifying logos, tracking their position on screen, and measuring their duration of visibility. What once required weeks of manual labor can now be executed in near real time.
From Raw Frames to Business Intelligence
APIs such as a Brand Mark and Logo Recognition API turn raw video into actionable data. They can detect the precise moments when a logo enters the frame, record how long it remains visible, and map its spatial position to create heatmaps and exposure timelines. This technology ensures that reports are built on objective, verifiable evidence rather than estimates. For executives, the benefit is clear: decision-making anchored in reliable data.
Expanding the Context with Multi-Layered Analysis
Beyond logo recognition, complementary APIs can enrich sponsorship reporting with additional layers of intelligence. Object detection and image labeling can show whether logos appear alongside players, referees, or scoreboards — contexts that affect audience attention. OCR can capture match clocks or digital overlays to synchronize exposure with key plays. Even anonymization tools can ensure compliance with privacy regulations when audience shots are involved. Together, these capabilities create a multidimensional view of sponsorship impact.
Balancing Standardized Tools with Custom Solutions
Off-the-shelf APIs provide a fast path to value, allowing organizations to pilot sponsorship analytics quickly. However, large enterprises and rights holders often have unique needs — specific event formats, multi-league data integration, or bespoke visualization dashboards. In such cases, custom computer vision development becomes a strategic investment. While it requires upfront commitment, a tailored solution enables organizations to reduce long-term costs, protect proprietary data flows, and establish a competitive edge by owning unique sponsorship intelligence.
Executive Relevance
For C-level leaders, the takeaway is not the technology itself but what it enables: a shift from opaque, generalized reports to transparent, granular insights that directly inform strategic decisions. With AI-powered vision APIs, sponsorship data becomes a living asset — accessible, reliable, and aligned with broader marketing performance frameworks.
In short, this technology turns sponsorship from a cost center into a measurable, optimizable driver of brand equity and revenue growth.

Conclusion
Sponsorship has always been about visibility — but in today’s market, visibility alone is not enough. Boards and investors increasingly expect clear evidence that every marketing dollar is delivering measurable value. Traditional reporting methods, built on static metrics and broad estimates, struggle to meet this demand. They leave executives with more questions than answers: Was the brand present in the moments that mattered most? Did placements outperform competitors? Did the investment translate into tangible business outcomes?
Heatmaps, exposure curves, and second-by-second timelines provide the clarity needed to move beyond these blind spots. They transform sponsorship analysis into an evidence-based discipline, one that mirrors the accountability and precision already expected in digital marketing. For C-level leaders, this means sponsorship is no longer a passive expenditure to be justified but a strategic instrument that can be measured, optimized, and aligned with broader business objectives.
The enabling technologies — AI-powered vision APIs — are no longer experimental. Ready-to-use solutions like Brand Mark and Logo Recognition APIs can deliver actionable insights at scale, while custom-built systems provide long-term strategic advantages for organizations with unique requirements. The path forward is not simply about adopting new tools, but about rethinking sponsorship itself as a data-driven asset class.
Executives who embrace this shift stand to gain more than sharper reports. They unlock competitive advantage through smarter negotiations, higher return on investment, and stronger alignment between brand exposure and audience engagement. In an era where attention is fragmented and every second counts, those who can see sponsorship exposure with precision — where it happens, when it happens, and how it resonates — will shape the future of sports marketing.
The next generation of sponsorship reporting is here. It is visual, dynamic, and powered by AI. The question for leaders is no longer if this transformation will occur, but when they choose to lead it.