Heatmaps and Timelines: Rethinking Sponsorship Reports
Traditional sponsorship reports reduce brand exposure to broad numbers — impressions, estimated reach, average screen time. But executives know these metrics miss what truly matters: where and when the logo appeared. Was it front and center during a decisive play, or lost in the background when attention was low?
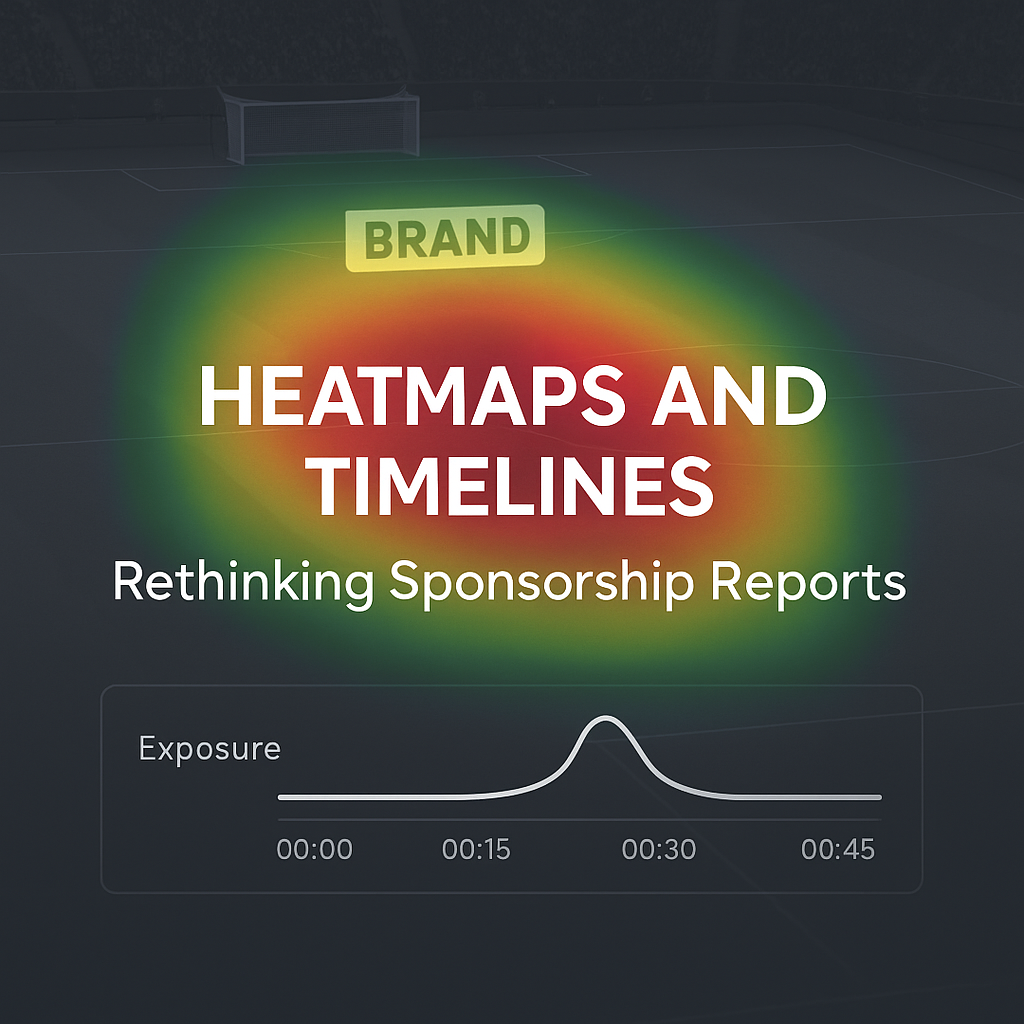
New AI-powered tools such as heatmaps, exposure curves, and second-by-second timelines are transforming sponsorship analysis. They provide a visual, contextual understanding of brand visibility, enabling marketers to benchmark campaigns, optimize placement strategies, and align exposure with the moments that capture maximum audience attention.
For C-level leaders, this shift turns sponsorship from a cost to be justified into a measurable, optimizable asset that drives brand equity and competitive advantage.