Heatmaps for Media Buyers: Where Your Logo Really Lands
Introduction – From Impressions to Pixel-Level Proof
In today’s high-stakes world of media buying, every second of screen time counts — and so does every pixel. As sponsorship deals and digital out-of-home (DOOH) advertising rates continue to climb, the days of relying solely on traditional impression metrics are fading fast. Leading brands and their agencies are under growing pressure to demonstrate not just that a logo appeared on screen, but exactly where it appeared and how much attention it truly captured. The boardroom expectation is clear: advertising investments must deliver measurable, defensible value, not vague “awareness.”
This need for precision is fueling a seismic shift in how brand visibility is tracked and valued. Gone are the days when media reports simply listed aggregate exposure hours or estimated audience sizes. Instead, C-level executives now demand pixel-level accountability — proof that their logos land in the zones that command the highest attention and engagement. It’s no longer enough to know that your brand made it onto the broadcast; you need to know whether it occupied prime real estate, or was relegated to the digital sidelines.
Enter the era of real-time, logo-based heatmap analytics. By leveraging the latest advances in computer vision and AI-powered video analytics, forward-thinking media teams can now map every instance of logo exposure across live broadcasts, streams, and virtual signage. These heatmaps visually reveal where on the screen your brand is most often seen, for how long, and in what context — transforming ambiguous “screen time” into actionable, negotiable assets.
This level of insight goes beyond meeting the demands of rights holders and sponsors. It empowers executives to negotiate better placement, optimize spend, and make data-driven decisions for future campaigns. Whether you’re evaluating the impact of a high-profile sports sponsorship, fine-tuning the rotation of digital boards, or testing new creative in a programmatic DOOH campaign, pixel-level analytics unlock a new era of transparency and control.
In the sections that follow, we’ll explore how heatmap-driven measurement is redefining the value of on-screen branding — and why the smartest media buyers are already using these tools to outpace the competition.
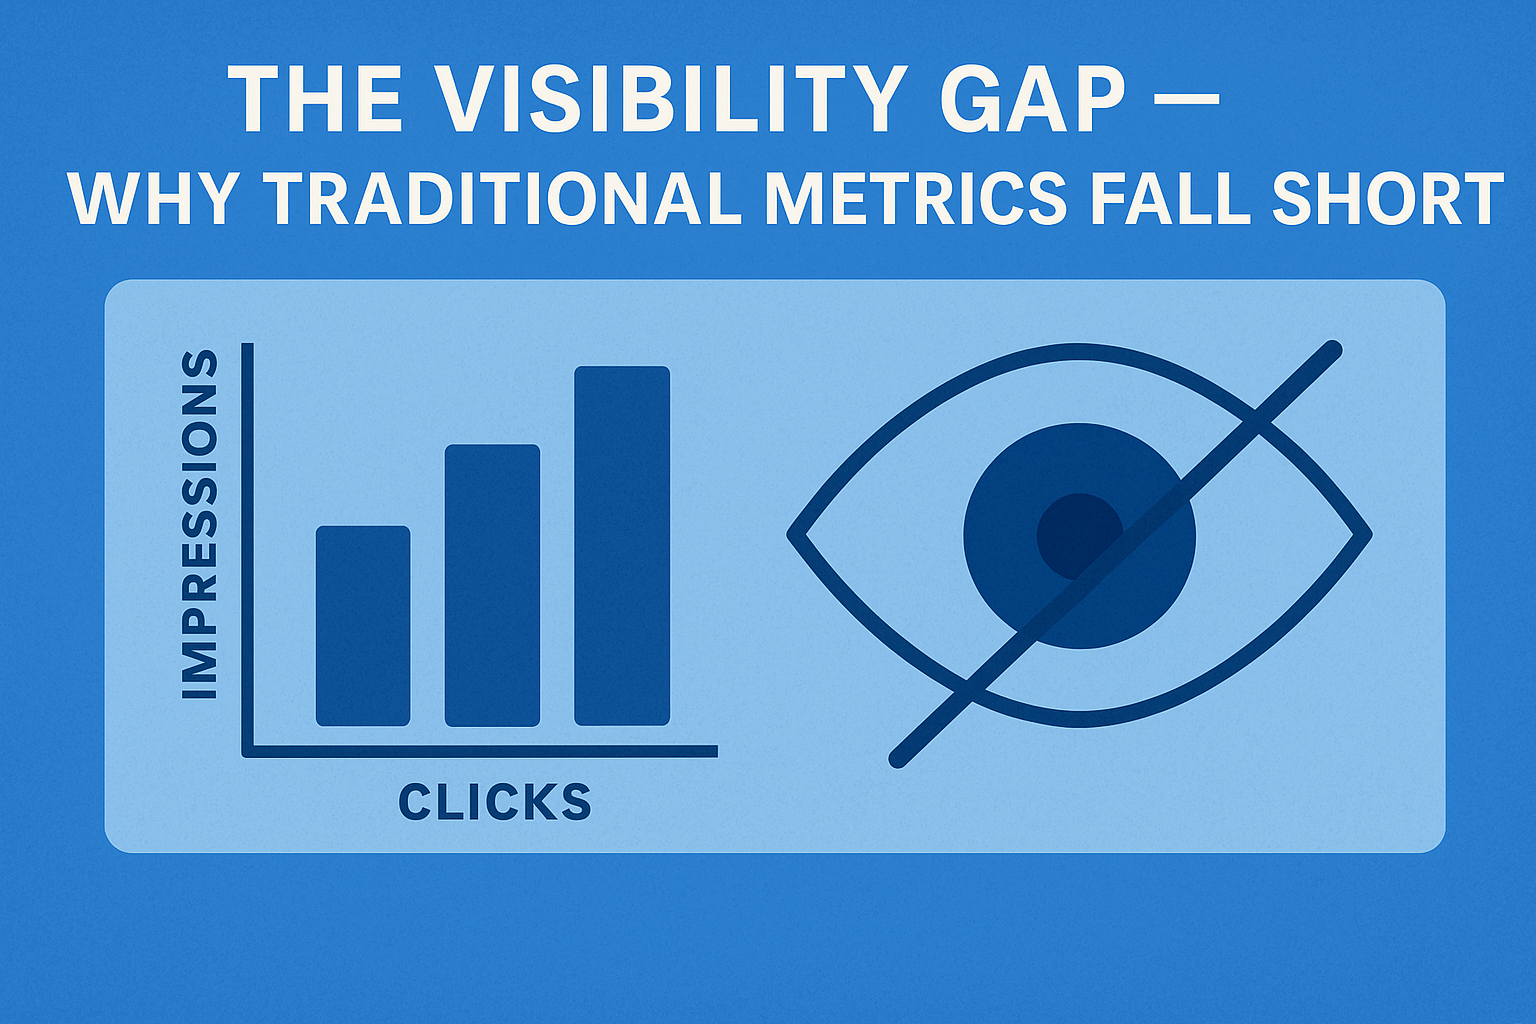
The Visibility Gap — Why Traditional Metrics Fall Short
For years, the standard toolkit for measuring advertising impact in sports, entertainment, and DOOH environments has consisted of gross rating points (GRPs), impressions, and estimated reach. While these metrics have provided a baseline understanding of campaign performance, they are rapidly losing relevance in a landscape where every detail of on-screen exposure is scrutinized by both buyers and sponsors.
The reason is simple: Traditional metrics do not capture the true quality — or even the actual presence — of brand exposure. An impression, after all, only tells you that a logo could have been seen; it offers no evidence about where on the screen the logo appeared, for how long, or under what circumstances. In high-value environments like live sports or prime-time broadcasts, this lack of precision is more than a missed opportunity — it’s a potential liability.
Consider the reality of modern media: digital boards shift, camera angles change in an instant, and viewers’ attention is pulled in multiple directions. In a single frame, your logo may share space with a dozen others, lost in visual clutter. Or worse, your brand may be relegated to a peripheral zone rarely noticed by the audience, despite high headline impression numbers. The result? Media buyers are often left negotiating multi-million-dollar deals with incomplete data, and sponsors are left wondering whether their investments are truly driving impact.
This is the heart of the visibility gap — the disconnect between what’s reported and what’s actually seen. As media budgets become more accountable and performance-driven, C-level leaders are recognizing the limitations of legacy metrics. Agencies and brands alike are seeking tools that move beyond aggregate counts and provide clarity about zone performance: Which areas of the screen deliver genuine engagement? Where does our brand actually command attention?
The shift is already visible in industry trends. According to recent surveys, a significant share of global advertisers plan to shift budgets toward placements that offer real-time feedback and granular visibility analytics. Competitive advantage now depends on the ability to prove — not just promise — the effectiveness of every placement.
Closing the visibility gap requires a new approach: one that quantifies not only exposure, but the precise context and quality of that exposure. In the next section, we’ll explore how heatmap analytics transform raw broadcast pixels into actionable intelligence — helping executives optimize media spend and negotiate with confidence.
Heatmap Analytics — Turning Broadcast Pixels into Placement Intelligence
As the demand for transparent, real-time measurement grows, heatmap analytics are emerging as a game-changer for executives who want to turn every pixel of screen time into a competitive advantage. Unlike traditional reporting that summarizes exposure with broad metrics, heatmaps provide a visual and data-driven story of exactly where — and how often — a brand mark appears during a broadcast or live stream.
How do heatmaps work?
Powered by advanced computer vision and AI, heatmap analytics process every frame of video to detect and track the precise location of logos and brand elements. Each detection is logged and aggregated, building up a color-coded map that instantly reveals the “hot zones” — those on-screen areas where the brand enjoys the highest frequency and duration of exposure. Cooler areas, by contrast, identify underutilized or low-impact zones that may not deliver the same value, regardless of overall impression counts.
Why does this matter for C-level decision-makers?
First, heatmaps transform abstract metrics into intuitive, actionable visuals that everyone in the boardroom can grasp. When negotiating sponsorship deals or digital board placements, executives no longer have to rely on vague promises; instead, they can point to concrete evidence of how and where a brand is seen. This clarity supports stronger negotiations, premium pricing for the most visible zones, and more effective performance reviews post-campaign.
Second, heatmap analytics enable dynamic optimization. For live events, media teams can adjust placements on the fly — reallocating brands to high-performing zones based on real-time data. In digital out-of-home or virtual signage, programmatic systems can automatically target “hot spots” to maximize impact. This not only drives better ROI for each placement but also builds trust with brand partners, who can see for themselves the value delivered by their investment.
Industry momentum is undeniable.
Search interest for “heatmap advertising,” “brand visibility analytics,” and “digital board optimization” has surged in recent quarters, reflecting a broader market shift toward data-backed media buying. Industry analysts predict that by 2026, a majority of top-tier sponsorship deals will require heatmap-based analytics as a standard part of the performance reporting package.
For C-level executives, the takeaway is clear: adopting heatmap analytics moves your organization from reactive reporting to proactive strategy. It enables smarter, faster decisions that maximize both the value of your inventory and the effectiveness of every media dollar spent.
In the next section, we’ll look under the hood at the technology making this revolution possible — and why the right blend of computer vision and AI is key to unlocking pixel-level placement intelligence.
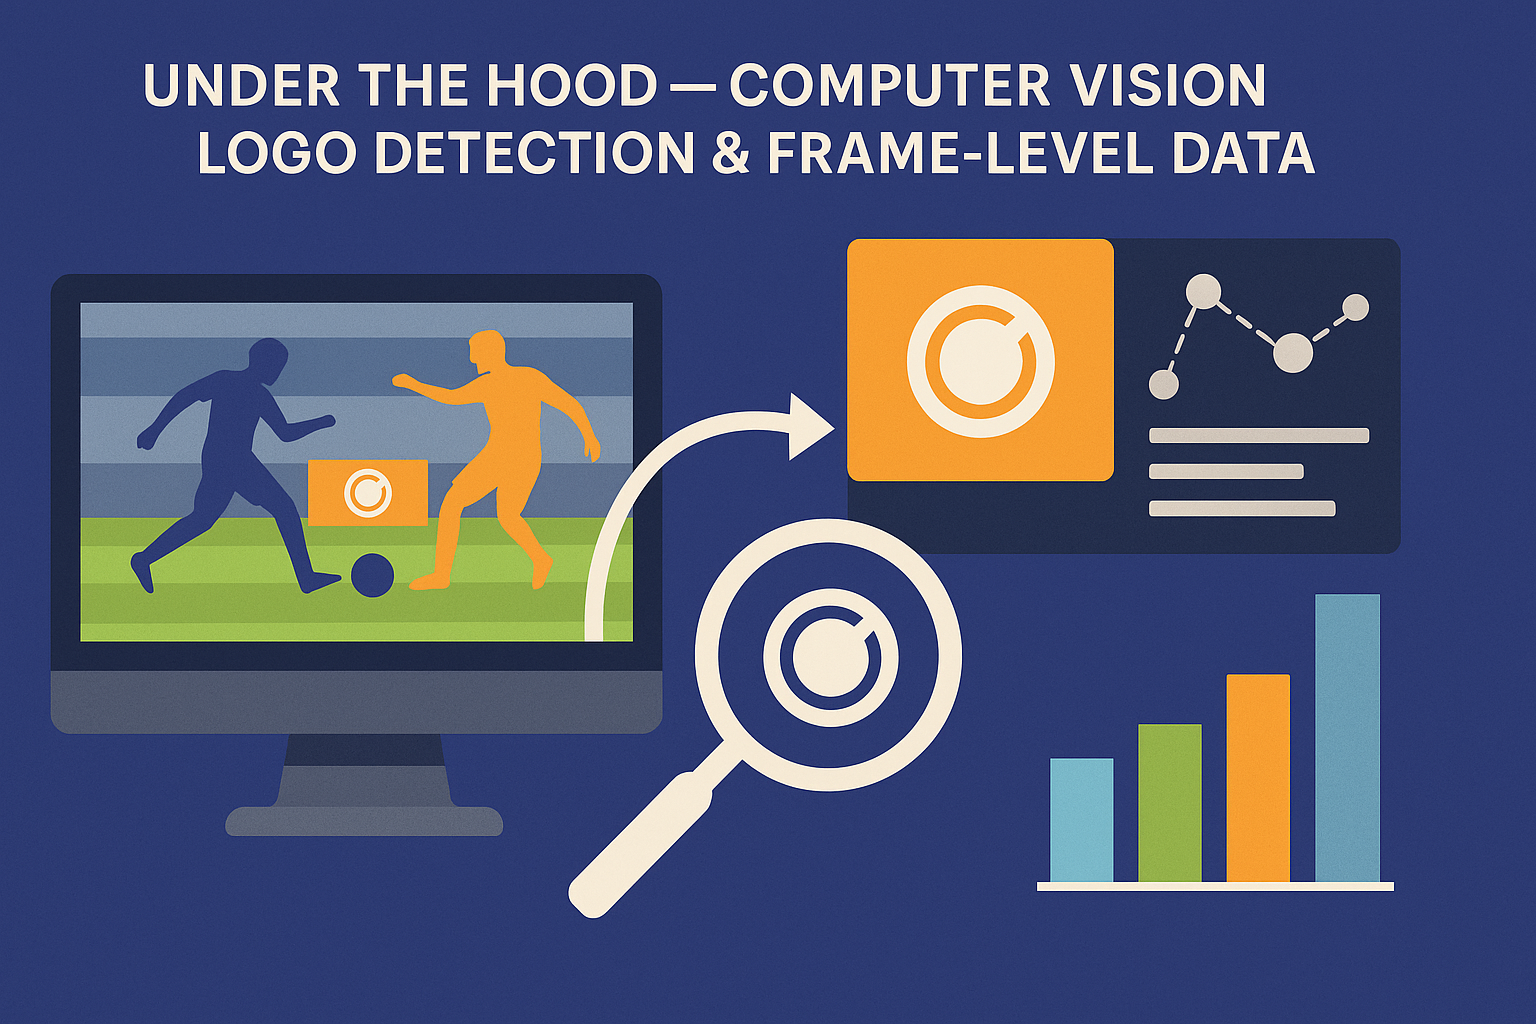
Under the Hood — Computer Vision, Logo Detection & Frame-Level Data
Behind every powerful heatmap lies an advanced ecosystem of computer vision algorithms and intelligent data pipelines. For C-level executives, understanding these building blocks is critical — not just for evaluating solutions, but for ensuring investments align with long-term business strategy, security, and scalability.
At the core: real-time logo detection and classification.
Modern heatmap analytics begin with AI models trained to recognize hundreds or thousands of brand marks, even in challenging conditions such as low lighting, motion blur, or partial occlusion. These models — such as those powering next-generation Brand Recognition APIs — scan each video frame, flagging every instance where a logo appears and precisely mapping its on-screen coordinates. Unlike manual or semi-automated tagging, this process is lightning-fast, objective, and scalable across entire seasons of content.
Object tracking and context capture.
But raw detection is only the starting point. The most valuable systems also track each logo’s journey across different camera angles, cuts, and overlays. Advanced tracking algorithms follow the logo as it moves, measuring not just presence, but duration, relative size, and even proximity to action hotspots (like the center circle in football or the finish line in motorsport). This level of detail is essential for producing heatmaps that reflect real consumer attention and screen dominance.
Frame-level data aggregation for executive clarity.
All this granular data is aggregated across time to build meaningful, high-resolution heatmaps. The system calculates not just where logos appear, but how often and for how long — producing metrics like dwell time, share-of-voice, and cumulative exposure by zone. These insights feed directly into dashboards, reports, and negotiation materials, empowering decision-makers to justify spend and optimize future buys with confidence.
Enterprise-grade scalability and privacy.
Executive teams must also consider how these solutions scale and integrate. Cloud-based APIs provide rapid deployment and cost-efficient batch analysis for recorded content, while edge processing options address privacy, regulatory compliance, and latency requirements for live or sensitive feeds. Leading platforms offer plug-ins for privacy features, such as face or number plate anonymization, ensuring analytics do not come at the expense of compliance.
The bottom line for the C-suite:
State-of-the-art heatmap analytics are not just about counting logos — they are about delivering robust, defensible evidence of brand visibility at the level of detail modern sponsorship demands. By investing in solutions built on proven computer vision technology, executives can future-proof their media strategy, enhance partner trust, and unlock new sources of value from every broadcast.
In the next section, we’ll examine how these technical capabilities translate into practical, high-impact applications across sports, esports, and the rapidly evolving landscape of virtual signage.

Strategic Wins — From Sports Arenas to Virtual Signage
For C-level executives, the promise of heatmap analytics isn’t just technological — it’s fundamentally strategic. The ability to translate raw pixel data into actionable intelligence has become a powerful lever for driving growth, optimizing spend, and gaining a sustainable competitive edge across a range of media environments.
Live Sports Broadcasts: Maximizing Every Moment
In the fiercely contested arena of live sports, sponsorship deals can hinge on split-second exposure and prime logo placement. Heatmap analytics empower rights holders, agencies, and sponsors to see exactly which zones deliver the highest engagement — often down to specific halves, periods, or event segments. For example, a football club can analyze heatmaps from the first half and adjust LED board placements or virtual overlays in real time, ensuring sponsors receive maximum on-screen value when the audience is at its peak. This not only increases satisfaction and retention but provides data-backed justification for premium pricing and contract renewals.
eSports & Streaming: Optimizing Digital Attention
The digital nature of esports and online streaming opens the door to even more dynamic optimization. Heatmap analytics reveal precisely where on the gamer’s interface, stream overlays, or backgrounds the audience’s attention gravitates. Armed with this insight, organizers and brands can reposition logos to the most impactful zones between rounds or matches — boosting visibility and engagement metrics. As the esports sponsorship market continues its rapid expansion, heatmaps are quickly becoming a must-have tool for negotiation and campaign review.
Programmatic DOOH: Powering Real-Time Ad Decisions
Digital out-of-home (DOOH) advertising is evolving toward automation and dynamic content delivery. Heatmap data can be fed directly into programmatic bidding engines, enabling real-time adjustments and premium pricing for inventory in “hot zones.” Brands can target the exact locations — on digital billboards, in-stadium screens, or even augmented reality placements — that deliver the highest attention and return. This level of precision unlocks new revenue streams for venue owners and agencies, while allowing advertisers to stretch every budget dollar further.
Driving Premium Value Across the Board
Industry research shows that analytics-driven inventory — backed by transparent, pixel-level evidence — can command a 12–18% premium over standard placements. Moreover, this transparency builds trust with sponsors and advertisers, fueling long-term relationships and greater willingness to invest in future campaigns. Whether you’re managing a global sports property, a growing esports platform, or a DOOH network, heatmap analytics provide the insights needed to lead negotiations, optimize inventory, and outperform the competition.
In the next section, we’ll break down how organizations can integrate these capabilities quickly and cost-effectively — whether through ready-to-use APIs or custom-built solutions tailored to unique business needs.
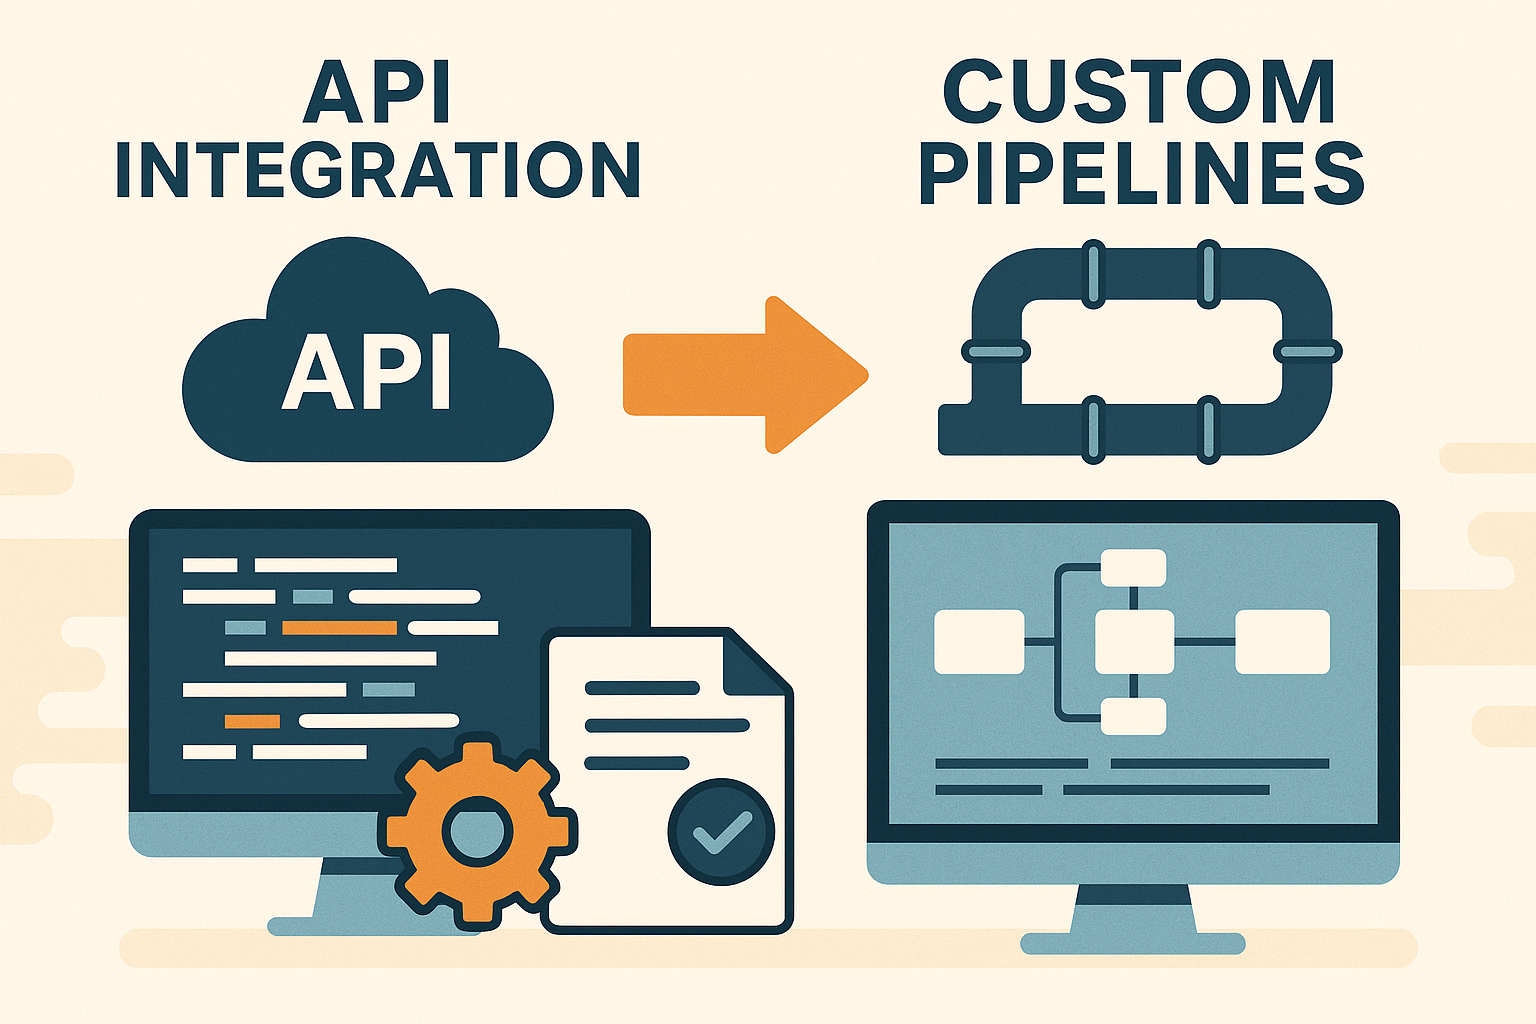
Implementation Playbook — API Integration vs. Custom Pipelines
When it comes to bringing heatmap analytics into your organization’s media-buying toolkit, C-level decision-makers must weigh the trade-offs between speed, scalability, investment, and control. The good news: today’s technology ecosystem offers multiple on-ramps to advanced computer vision and analytics — whether you need a rapid pilot or a robust, enterprise-grade solution.
The Fast Track: Plug-and-Play APIs for Immediate Impact
For organizations looking to unlock value quickly, pre-built APIs offer a frictionless path to results. Modern vision APIs can detect logos, track movement, and generate heatmaps with minimal integration overhead. These cloud-based services allow media teams to upload video content or connect live streams, receiving back actionable reports and visualizations within hours — not months. This approach is ideal for pilot campaigns, proof-of-concept projects, or when your IT team is focused on core business systems.
The pay-as-you-go pricing model of many API platforms also helps control costs and align spend with usage. Security and compliance are handled by the provider, with options for batch processing, large-scale parallel analysis, and regular updates as the technology evolves. For most brands and agencies, this “out-of-the-box” integration provides all the speed and flexibility needed to experiment, learn, and show quick wins to stakeholders.
Enterprise Path: Custom Pipelines for Strategic Advantage
For those with unique requirements — such as on-premises deployment, multi-camera synchronization, custom detection classes, or the need for advanced data privacy — building a tailored analytics pipeline is the way forward. This route typically involves partnering with a specialized vendor or in-house data science team to develop custom models, fine-tune algorithms, and integrate vision workflows into your existing data stack.
While the upfront investment is higher, the long-term benefits are substantial. Custom pipelines allow for full control over data handling, compliance with jurisdictional regulations, integration with proprietary systems, and optimization for latency and resource usage. As your needs evolve, you can expand capabilities to cover new content types, integrate with programmatic ad platforms, or layer on additional AI features (such as automated content moderation or sentiment analysis).
Decision Factors for the C-Suite
Selecting the right implementation path is a strategic choice. Executives must balance capital expenditure (CAPEX) versus operational expense (OPEX), consider data sovereignty and security mandates, and assess the speed at which results are needed. For many, a hybrid approach — piloting with APIs and scaling to custom deployments as requirements mature — delivers the best mix of agility and long-term value.
A Competitive Edge That Scales With You
No matter which path you choose, integrating heatmap analytics into your media operations signals a commitment to transparency, accountability, and innovation. Whether you’re running a single campaign or managing a global portfolio of placements, these tools ensure every media dollar is deployed with maximum intelligence and measurable impact.
In the final section, we’ll bring together the key takeaways for executives looking to turn heatmap data into tangible business advantage — and outline next steps for moving from insight to action.

Conclusion – From Heat to Action
For C-level executives navigating the fast-changing world of media investment, the shift from traditional exposure metrics to heatmap-driven analytics is more than a technological evolution — it’s a transformation in how business value is created, proven, and defended.
Today’s advertisers and rights holders face mounting demands for transparency, accountability, and ROI. Legacy metrics like impressions and gross rating points are no longer enough to win trust or maximize return. With the advent of AI-powered heatmaps, organizations can finally move beyond vague exposure claims to concrete, visual evidence of brand visibility — down to the pixel and second. This not only unlocks a new level of negotiating power in sponsorship and media deals, but also builds enduring confidence among stakeholders and partners.
The real power of heatmap analytics lies in their ability to turn insights into action. Executives can now benchmark every campaign, identify top-performing zones, and optimize placements before the next rights cycle or contract renewal. Dynamic heatmap data supports more agile planning, more persuasive boardroom conversations, and smarter allocation of every marketing dollar.
Implementing this capability is no longer a distant goal. With flexible API solutions available for rapid deployment and custom computer vision pipelines offering strategic depth, organizations of any size can start realizing value today. Early adopters are already reaping the benefits — commanding premium pricing for “hot zone” inventory, strengthening sponsor relationships, and staying one step ahead of the competition.
The next step is clear: Audit your current media placements, benchmark performance with heatmap analytics, and empower your teams to make data-driven decisions. Whether you begin with a pilot project or invest in a tailored enterprise solution, the ability to pinpoint exactly where your logo lands — and how it performs — will be central to winning in tomorrow’s media landscape.
The future belongs to organizations that transform heat into action. Those that do will not only protect their investments, but unlock new sources of value and influence in a rapidly evolving digital world.