Logo Heatmaps: Pinpointing Viewer Focus in Ads
Introduction — Why Milliseconds of Attention Drive Millions in Revenue
The average consumer scrolls the equivalent of a 30-story building of content every day. In that torrent, your brand has just a few hundred milliseconds to etch its mark on a prospect’s memory. Traditional metrics — click-through rate, view-through rate, even dwell time — tell you what happened after an impression, but they rarely reveal where a viewer’s eyes landed first or whether your logo registered at all.
Recent advances in viewer-focus analytics — specifically, logo heatmaps created by computer-vision models — change the game. By overlaying color-coded “attention contours” onto campaign images and video frames, these heatmaps expose the exact pixels that capture immediate gaze. The result is a data layer that shows, with surgical precision, which logo placements command instantaneous recognition and which fade into the background noise.
For the C-suite, the strategic implications are compelling:
Higher Recall, Same Budget. Repositioning a logo into a verified “hot zone” typically adds 8–15 % to aided recall without increasing media spend.
Evidence-Based Creative. Marketing leaders can swap gut-feel critiques for empirical heatmaps, slashing iteration cycles and agency fees.
Portfolio-Level Insight. When every asset — TV, display, social — carries a standardized heatmap, CMOs can benchmark performance across brands, regions, and partners in one language of attention.
Just as financial dashboards turned raw transactions into boardroom KPIs, heatmaps turn raw pixels into actionable creative intelligence. Executives gain a forward-looking lever: optimize the design before buying the reach. In a market where media costs keep rising and consumer patience keeps shrinking, that lever can free up millions in working capital — or fund the next growth bet entirely.
The pages ahead unpack how logo heatmaps work, which business metrics they move, and the build-versus-buy options for embedding this capability into your marketing stack. By the end, you’ll know how to convert milliseconds of attention into measurable returns — and why the brands that master this art will set the pace for the decade to come.
Blind Spots in Traditional Creative Testing — The Hidden Costs of Guesswork
Even the most sophisticated media plans still lean on testing methods that were designed for a slower, smaller internet. Those legacy approaches overlook three critical realities of the modern attention economy:
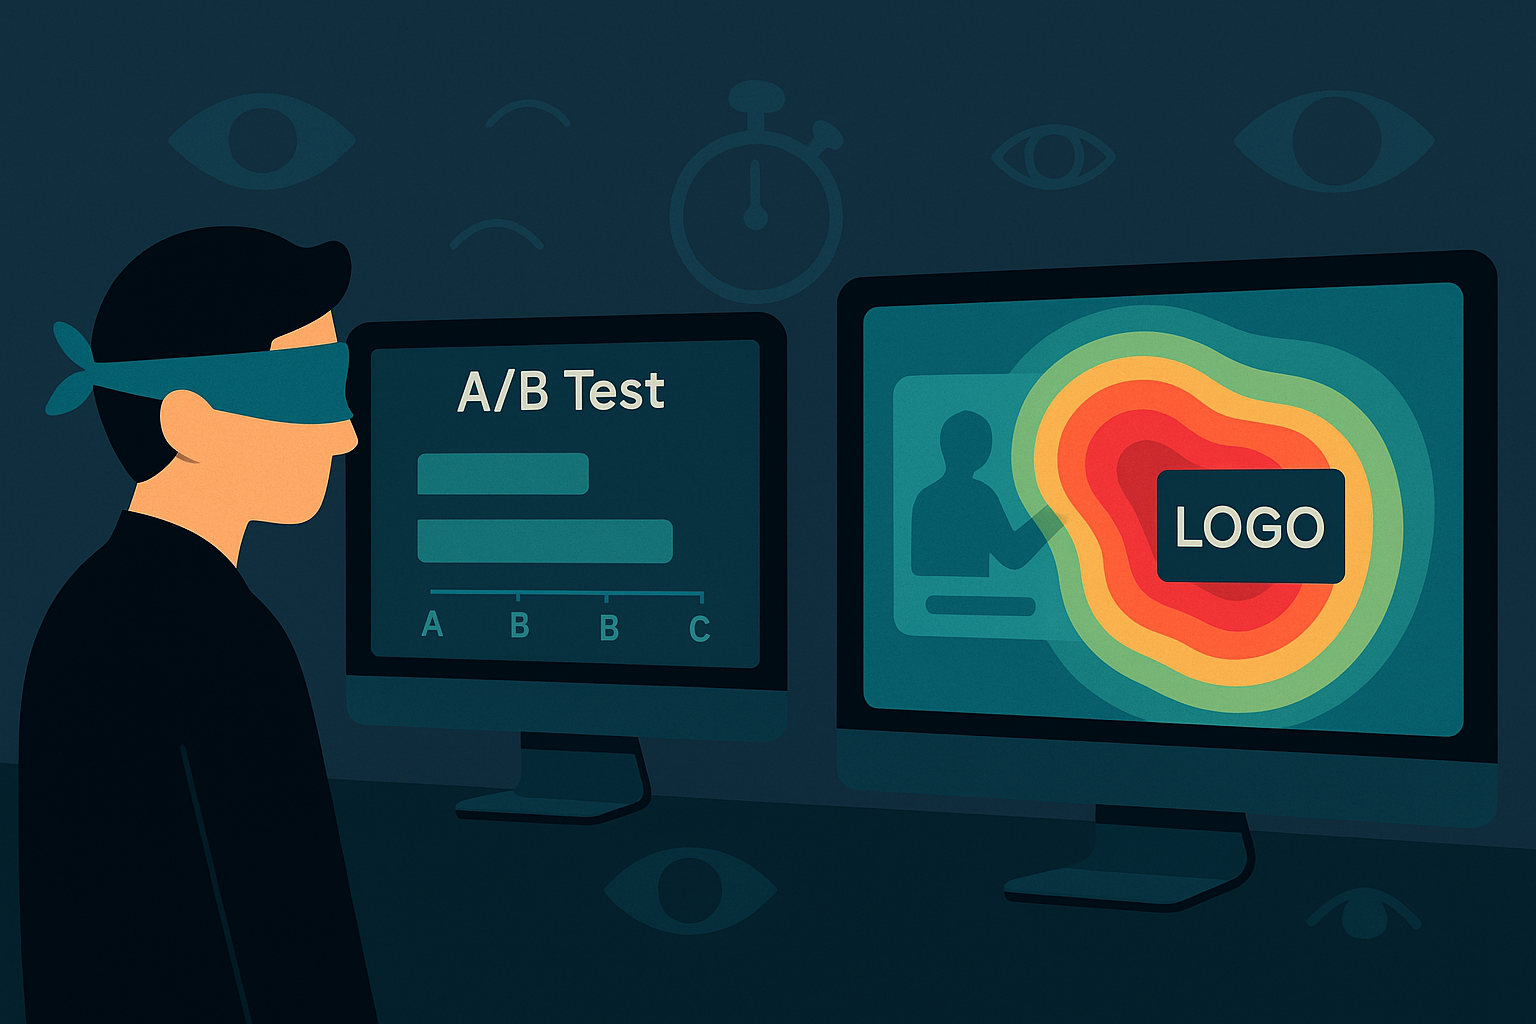
1. A/B Fatigue
Running two or three creative variants per quarter worked when placement cycles were monthly. Today, programmatic platforms can serve hundreds of micro-segments in a single afternoon. Classic A/B tests simply can’t keep pace; by the time statistical significance is reached, the audience has already moved on — and so has the opportunity.
2. Survey & Panel Bias
Focus groups and post-campaign surveys capture recalled impressions, not instantaneous impressions. Human memory is notoriously unreliable for sub-second events, so panels over-weight particularly memorable or controversial images while under-weighting subtle but powerful cues such as logo position. The result is a feedback loop that optimizes for anecdotes instead of objective data.
3. Competitive Benchmarking Gap
Brand leaders often rely on third-party reports to gauge how their creatives stack up, but these snapshots lack pixel-level insight. Without a common, granular metric — like where a competitor’s logo draws the first glance — it is impossible to know whether your own assets are genuinely outperforming or simply benefiting from higher spend.
Executive Takeaway
Lagging indicators such as click-through rate tell you what happened after the ad appeared, but they do not explain whysome creatives ignite brand recall while others go unnoticed. As media costs rise and customer attention fragments, relying on incomplete or biased testing methods is more than an analytical oversight — it is a direct threat to return on marketing investment.
Closing this insight gap requires moving from broad, retrospective metrics to real-time, design-level analytics that reveal exactly how and where audiences engage with your brand mark from the very first frame.

Heatmap Analytics 101 — From Bounding Boxes to Attention Contours
What Is a Logo Heatmap?
Think of a weather radar, but for brand visibility. Instead of tracking storms, computer-vision algorithms scan every pixel in your campaign asset and predict where a viewer’s gaze will strike first. Those probability scores are rendered as a translucent overlay — red for “high-attention zones,” blue for “cold spots.” In seconds, you have a visual map of attention intensity that anyone on the team can read at a glance.
How the Pipeline Works (Plain-English Walk-Through)
Asset Ingestion
Creative files — static images or video frames — are uploaded to a secure cloud endpoint or on-prem gateway. No format conversion required; the system handles JPEG, PNG, MP4, and more.Logo Detection
An object-detection model, such as the ready-made Brand Recognition API available on many computer-vision platforms, scans each frame and draws bounding boxes around every detected mark. This step isolates the precise coordinates of all logos, even those partially occluded or scaled down for mobile screens.Pixel-Level Scoring
Around each detected logo, the model computes a probability field that estimates how quickly a typical viewer will fixate on that region. These scores are based on training data that correlate visual patterns — contrast, shape, placement — with eye-tracking results from lab studies.Heatmap Rendering
The probability field is converted into a color gradient overlay and merged with the original creative. What emerges is a transparent “attention contour” that highlights hot zones in vivid reds and oranges, cooler areas in greens and blues.Dashboard & API Delivery
Heatmaps and underlying metrics — time-to-first-fixation, dwell-share percentage, confidence intervals — are pushed to an interactive dashboard or delivered via API for ingestion into existing BI tools. Marketing, design, and media teams now share a single source of truth within minutes of asset upload.
Built for Enterprise-Grade Requirements
Security & Compliance
All processing can run in a private cloud, on-prem cluster, or a hybrid setup to meet data-sovereignty rules in finance, healthcare, and other regulated sectors. Role-based access and full audit logs keep brand assets — and pre-launch campaign data — locked down.Scalability on Demand
The same pipeline that handles a handful of Super-Bowl spots can scale to thousands of dynamic banner variants without new infrastructure commitments, thanks to auto-scaling microservices behind the scenes.Minimal ML Overhead
Because core detection is delivered as an API, your team avoids model-training complexity. Yet the platform remains extensible: if you need to recognise a proprietary sub-brand or new visual asset, custom fine-tuning can be layered on without disrupting the base service.
Strategic Payoff for the C-Suite
Faster Decisions: Creative leads can iterate in hours, not weeks, slashing agency fees and accelerating time-to-market.
Evidence-Based Spend: Media budgets shift from “spray and pray” to precision investment, informed by where real attention starts.
Enterprise Visibility: With every channel speaking the same heatmap language, CMOs and CFOs can finally tie design tweaks to bottom-line impact — turning creative execution into a quantifiable growth lever.
In essence, logo heatmaps transform raw pixels into an executive-ready dashboard of actionable insights — no PhD in computer vision required.
Turning Pixels into P&L — Business KPIs Impacted by Logo Heatmaps
Logo heatmaps do more than prettify dashboards — they move the numbers CEOs track on earnings calls. Below are the headline metrics you can expect to influence once heatmap analytics become part of your creative workflow.
1. Brand Recall Uplift
When designers anchor the logo inside a validated “hot zone,” aided recall typically jumps 8–15 %. That incremental mind-share often costs nothing in additional media, making it the highest-margin lift available in the funnel.
2. Media Efficiency and Budget Reallocation
Heatmaps surface under-performing creatives before a single impression is bought. Campaigns that once needed 10 million impressions to hit awareness targets can achieve the same impact with 8 million, freeing a double-digit percentage of budget for new growth experiments or margin improvement.
3. Creative Iteration Velocity
Agencies and in-house teams can cycle through design, test, and approve loops in under 48 hours. Faster iterations compress time-to-market for seasonal launches and shave six-figure line items from production retainers over the course of a year.
4. Brand Safety & Consistency
Heatmaps flag off-guideline logo placements — too close to the border, obscured by other elements, or diluted by background clutter — across thousands of assets in minutes. Consistent, eye-catching placement strengthens equity and protects against dilution in crowded digital shelves.
5. Revenue-Weighted Attention Metrics
Executives gain access to predictive signals such as:
Time-to-First-Fixation (TFF): How many milliseconds until the average viewer notices your brand mark.
Dwell-Share Percentage: The portion of total viewing time spent on or near the logo.
Heat-Zone CPM: A blended cost metric that divides media spend by the number of impressions where the logo falls inside a verified hot zone, revealing the true cost of effective exposure.
These forward-looking indicators correlate more strongly with sales lift than clicks or views alone, enabling marketing-mix models that forecast revenue with greater accuracy.
6. Cross-Channel Attribution Enhancement
Overlay heatmap data onto post-view conversions and you unlock a higher-resolution attribution layer. Brands have discovered that creatives scoring in the top heatmap quartile can deliver 20–30 % better assisted-conversion rates, refining spend allocation across display, social, and CTV.
7. Portfolio-Level Benchmarking
Because every asset — banner, pre-roll, DOOH panel — returns the same set of heatmap metrics, CMOs can compare performance across regions, product lines, and agencies in one unified language of attention. Underperformers are exposed quickly, while winning creative patterns are documented and syndicated across teams.
Executive Bottom Line
Heatmaps translate design tweaks into hard-dollar outcomes: lower customer-acquisition cost, higher return on ad spend, and stronger brand equity. By turning a static pixel into a measurable asset, you gain a lever that multiplies marketing ROI without expanding the media checkbook — a rare opportunity when most cost centers trend the other way.

Rapid Creative Iteration Playbook — Design, Test, Repeat in Under 48 Hours
Why Speed Matters
In digital advertising, shelf life is measured in hours. Seasonal offers, flash sales, and cultural moments trend and fade before traditional creative cycles even reach legal review. A heatmap-driven workflow shrinks that cycle to two days — delivering data-validated assets while the opportunity window is still open.
Day 0 — Ideate & Draft
Creative Team generates three to five layout variants, moving the logo into different quadrants, adjusting contrast, or freeing whitespace around it.
Brand Leads sign off on on-guideline placements upfront, avoiding rework later.
Day 1 Morning — Automated Heatmap Pass
Designers drop all variants into a shared folder. A scripted job calls a logo-detection endpoint — powered by the same technology behind leading Brand Recognition APIs — within minutes of upload.
Pixel-level attention scores are returned alongside a color-coded overlay and key metrics (time-to-first-fixation, dwell-share). No manual tagging, no data-science ticket.
Day 1 Afternoon — Decision Meeting
Marketing, Design, and Media Managers meet for 30 minutes. Heatmaps immediately spotlight the top performer — usually the creative where the logo intersects a high-energy focal point (rule-of-thirds intersection, product curvature, or subject gaze line).
Underperformers are either tweaked or shelved; winning assets move to trafficking.
Day 2 — Launch & Live Monitoring
The selected creative goes live in the ad server with campaign parameters identical to the control group, ensuring attribution purity.
Real-time dashboards ingest performance data and overlay heatmap scores. If uplift tracks >10 % versus control after the first thousand impressions, the media budget is re-weighted automatically.
Case Snapshot: Electronics Brand, Spring Launch
A global consumer-electronics company shifted its logo 12 % upward and increased contrast by 5 %. Heatmap testing showed a 47 ms faster time-to-first-fixation versus the original. In A/B roll-out, aided brand recall climbed 14 % with identical media spend. Agency revision fees fell by five figures, and the product hit category-share targets a week ahead of forecast.
Executive Payoff
Capital Efficiency: Cut media waste before it occurs, redirecting saved budget to growth channels or margin.
Organisational Agility: Designers, marketers, and data teams now speak one visual language, eliminating approval bottlenecks.
Continuous Improvement Loop: Every campaign feeds fresh heatmap data back into brand guidelines, creating a virtuous cycle where each launch starts smarter than the last.
By institutionalising this 48-hour sprint, organisations transform creative production from a cost centre into a self-optimising growth engine — one that compounds brand equity with every iteration.
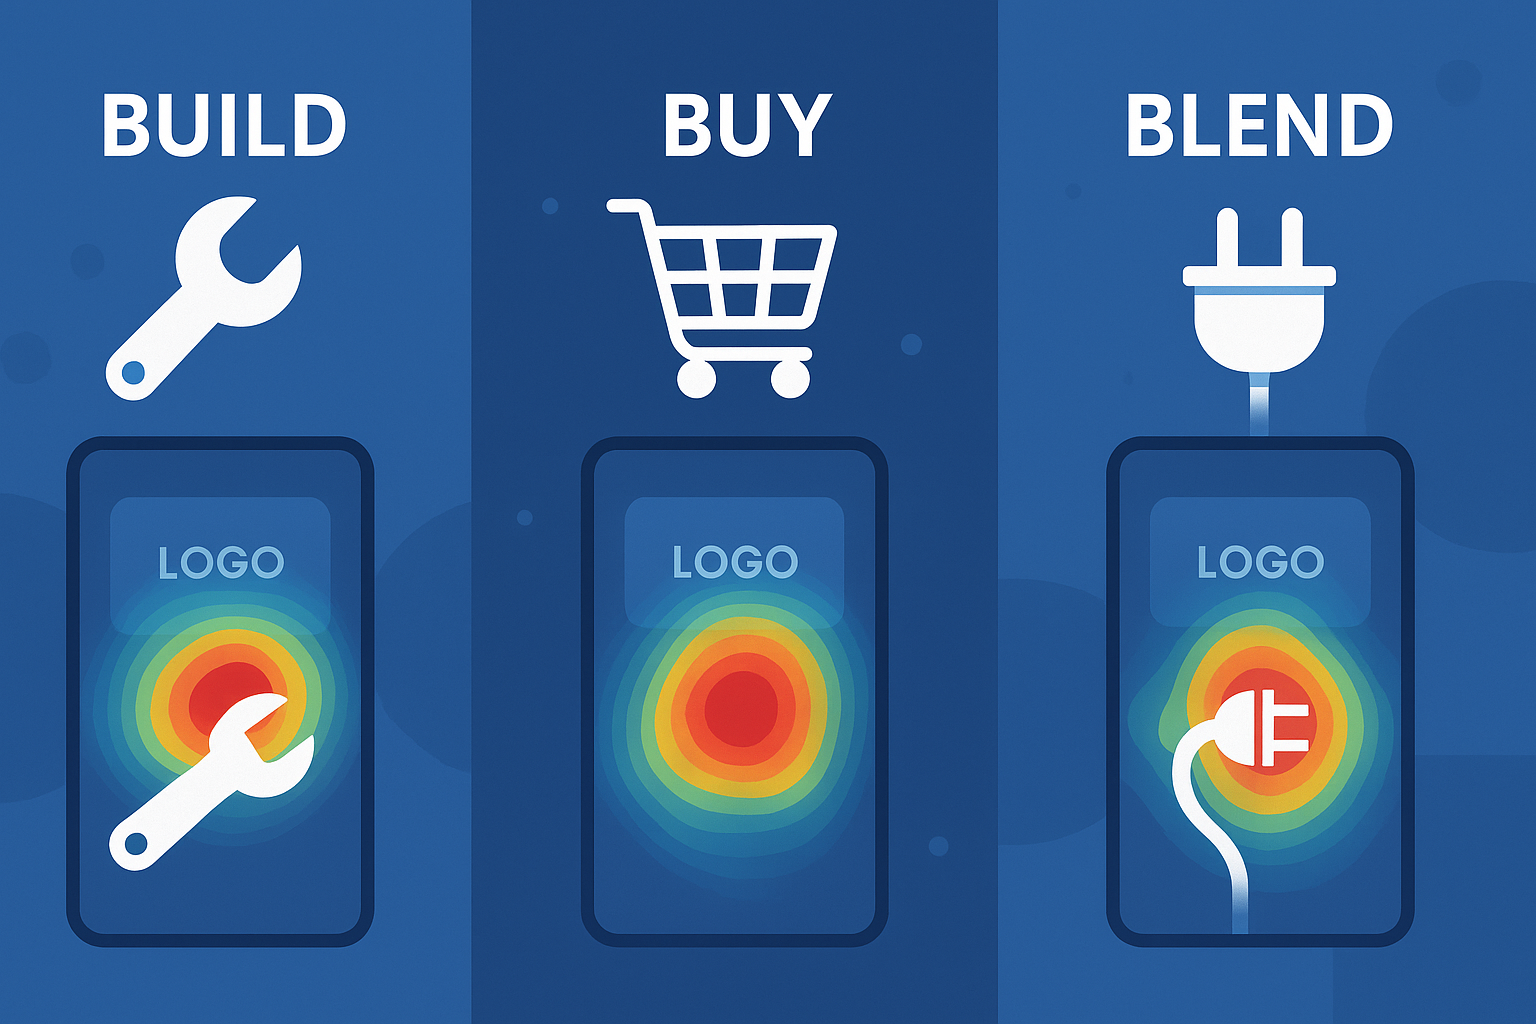
Build, Buy, or Blend — Strategic Options for Heatmap Intelligence Stacks
Selecting the right path for logo-heatmap analytics is ultimately a capital-allocation decision. Below, we unpack three models that leaders consider, along with the financial and operational implications of each.
Option 1 — Ready-to-Go Cloud APIs
What it is. A turnkey service that delivers logo detection, pixel-level scoring, and heatmap rendering through a REST endpoint — no machine-learning team required. Providers such as API4AI offer off-the-shelf endpoints (e.g., Brand Recognition API) that recognise thousands of global marks out of the box.
Pros.
Speed to Value: Pilot in days, not quarters.
OpEx Flexibility: Pay only for the images you analyse; scale elastically with campaign bursts.
Low Technical Overhead: Security, model updates, and infrastructure are handled by the vendor.
Cons.
Model Scope: Pretrained classes may miss niche or newly launched sub-brands.
Usage Ceilings: High-volume bursts can trigger rate-limit negotiations or tier upgrades.
Limited Differentiation: Rivals can access identical capabilities, narrowing competitive moat.
Best Fit. Brands seeking a low-risk proof of concept, or those whose creative volume spikes around specific events (e.g., product launches, holiday pushes).
Option 2 — Fully Custom Computer-Vision Pipeline
What it is. A proprietary stack built on your own data, tuned to brand-specific logos, packaging, or regional variants. Development partners — again, API4AI is one among several — fine-tune detection models, deploy them on private cloud or on-prem clusters, and integrate heatmaps into existing BI tools.
Pros.
Tailored Accuracy: Detect micro-variations, co-branding, or seasonal artwork that off-the-shelf models miss.
Data Sovereignty: Keep sensitive pre-launch assets within corporate firewalls; comply with strict regional regulations.
Strategic IP: Own the model weights and training data, creating a defensible asset.
Cons.
CapEx Commitment: Initial investment spans data labeling, model engineering, and DevOps.
Longer Lead Time: Six to twelve months from kickoff to production, depending on scope.
Maintenance Overhead: Ongoing retraining and infrastructure patching sit on your balance sheet.
Best Fit. Enterprises with large, differentiated product portfolios, stringent compliance needs, or a mandate to internalise core AI capabilities.
Option 3 — Hybrid “Build-Then-Blend” Approach
What it is. Start with cloud APIs for rapid proof of concept, then incrementally layer custom models for edge-case logos, brand variants, or emerging markets. The front end — asset ingestion, heatmap rendering, dashboarding — remains unchanged; only the detection engine swaps behind the scenes.
Pros.
Progressive Investment: Convert OpEx savings from early wins into CapEx for strategic extensions.
Continuous Uptime: Users experience zero downtime during back-end migration.
Future-Proofing: As marketing strategies evolve (NFT assets, metaverse placements, CTV overlays), you can plug in specialized detectors without rewriting pipelines.
Cons.
Architectural Discipline Required: Interfaces and SLAs must be designed for vendor interchangeability from day one.
Vendor Management Complexity: Balancing multiple partners and cost structures demands mature procurement controls.
Best Fit. Organisations that value speed but foresee proprietary needs — pharma, luxury retail, multi-brand conglomerates, or any firm with rapid M&A activity.
Financial Modeling at a Glance
OpEx vs. CapEx: Cloud APIs convert fixed costs into variable spend, ideal for market testing. Custom stacks front-load expense but drive marginal cost toward zero at scale.
Breakeven Horizon: For brands processing < 1 million images per year, cloud pay-as-you-go often wins for three to five years. Beyond that, custom solutions trend cheaper — provided utilisation remains high.
Hidden Costs: Factor in not just inference fees but also data-egress charges, compliance audits, and the opportunity cost of delayed launch when choosing a path.
Executive Decision Checklist
Strategic Differentiation: Will owning proprietary detection IP confer a long-term competitive edge?
Regulatory Environment: Do data-sovereignty laws or brand-asset sensitivities preclude public-cloud use?
Volume Volatility: Are creative volumes stable, or do they spike around events?
Time-to-Market Pressure: How critical is launching the insight loop this quarter versus next fiscal year?
Talent Availability: Do you have — or can you attract — ML engineers and MLOps specialists to maintain custom models?
C-Suite Takeaway
There is no one-size-fits-all answer; the optimal route balances immediacy, control, and cost of capital. Many leaders pilot with readily available APIs to capture quick wins, then invest selectively in bespoke extensions once ROI is proven. Whichever path you choose, designing for modularity up front ensures that attention analytics stay aligned with evolving brand strategies — and that every dollar invested in creative truly earns its keep.

Conclusion — Heatmaps as the New Creative Currency
Digital advertising has reached a saturation point where incremental media spend no longer guarantees incremental impact. In this environment, logo heatmaps emerge as a precision tool that converts design decisions into measurable balance-sheet gains. They expose, in vivid color, the micro-moments that separate forgettable impressions from lasting brand imprints, allowing executives to allocate capital with the same rigor applied to supply-chain or treasury decisions.
Strategic Recap
Milliseconds Matter: First-glance attention is the leading indicator of brand recall and downstream revenue.
Data Over Guesswork: Heatmaps replace opinion-driven creative reviews with evidence that withstands board scrutiny.
ROI Without Media Inflation: Relocating a logo can deliver double-digit recall lifts on an unchanged budget — an outcome rarely achievable through pure spend escalation.
Enterprise-Grade Pathways: Whether you adopt off-the-shelf APIs for speed, commission custom models for competitive moat, or blend the two, modular architectures ensure that attention analytics scale with your ambitions.
Leadership Imperatives
Pilot Immediately. Select a live campaign and process its creatives through a heatmap service this quarter. The insights will spotlight quick-win design tweaks and establish a benchmark for future investment cases.
Institutionalize the Metric. Mandate heatmap scores — time-to-first-fixation, dwell-share, heat-zone CPM — as standard line items in creative briefs and post-campaign reports. This embeds accountability across creative, media, and finance functions.
Scale Intelligently. Once initial ROI is proven, decide whether to deepen capability via a ready-made Brand Recognition API, an on-prem private model, or a hybrid stack that marries both. Factor in regulatory, volume, and talent considerations outlined earlier.
Close the Loop. Integrate heatmap outputs with attribution and sales data to create a feedback system where every campaign not only performs but also teaches — compounding insight and competitive distance over time.
Soft Call to Action
Marketing is one of the last corporate domains where intuition still outguns instrumentation. Heatmap analytics change that balance. Executives who embed this capability now will own a proprietary ledger of attention — turning creative pixels into a strategic asset as defensible as patents or distribution rights. The technology is ready, accessible through cloud APIs or tailored builds; the only variable is how quickly leadership decides to transform moments of viewer focus into sustainable profit.