Analyzing Competitor Presence in Event Footage
Introduction — Why Every Logo in Event Media Matters
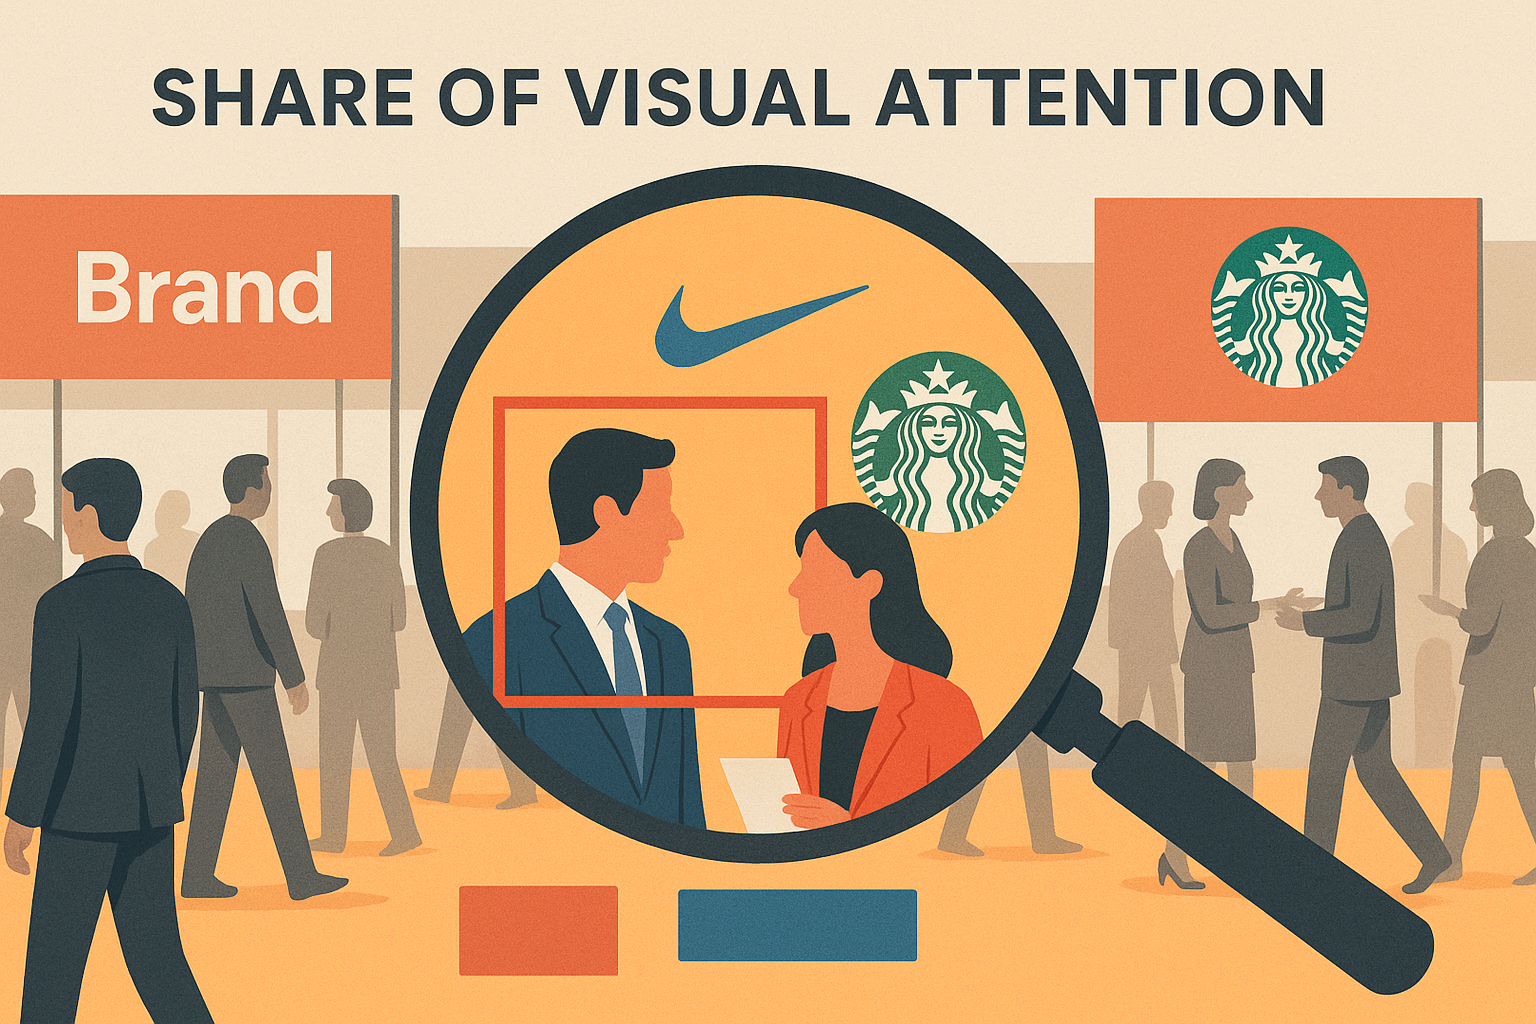
In today’s business landscape, visibility is currency. Whether your brand is showcased at a global trade show, a local street festival, or a televised sports event, the real question is not simply “Were we there?” but “How visible were we compared to our competitors?”
Every photo, livestream, or news clip from an event becomes part of a massive, constantly growing library of shared media. And in that media, competitor logos often appear — sometimes more frequently and prominently than your own. These appearances are not accidental; they’re the byproduct of strategic booth placements, sponsorship agreements, and, increasingly, opportunistic positioning by rivals.
For years, marketers and sponsorship teams relied on subjective impressions — what they remembered seeing or what a small set of photos captured. But impressions are no longer enough. In an era where audiences consume event coverage across dozens of platforms and formats, visual share of attention is emerging as a measurable, board-level KPI. This shift mirrors a larger trend in marketing and brand management: the move from anecdotal evidence to quantifiable, defensible metrics.
C-level leaders should view competitor presence in event media as both a risk and an opportunity. The risk lies in being overshadowed — having your brand’s investment diluted by a competitor’s stronger visual footprint. The opportunity is in turning that visibility gap into actionable intelligence: identifying exactly where, when, and how your rivals are capturing attention, and then adjusting your own strategy to outmaneuver them.
Advances in AI-powered image processing — especially in brand mark and logo recognition — make this level of analysis possible at scale. By scanning thousands of images and hours of video, businesses can now quantify their share of the visual landscape with precision, compare it directly against competitors, and refine event placement strategies for maximum impact.
In short: Every logo in event footage matters because each one represents a moment of influence. If you’re not measuring it, you may already be losing ground without realizing it.
The Untapped Metric — Share of Visual Attention
For decades, brand visibility at events has been measured in terms of sponsorship packages purchased, logo placements promised, or the number of promotional assets distributed. These figures look neat in a contract, but they don’t tell the full story of how much audience attention you actually captured compared to your competitors.
This is where share of visual attention comes in — a metric that quantifies the proportion of time and space your brand’s logo or identity appears within the total visual content generated from an event. It’s not about how much you paid for a banner; it’s about how often that banner actually appeared in the photos, videos, and livestreams that audiences consumed.
Unlike traditional media metrics, which track mentions, hashtags, or ad impressions, share of visual attention focuses on silent brand impressions — the moments when your logo is seen without being spoken about. This is critical because research consistently shows that visual exposure builds brand familiarity and trust, even in the absence of verbal endorsement.
For executives, this metric has three major strategic implications:
Sponsorship ROI Assessment — Instead of relying solely on contractual visibility guarantees, you can measure the real exposure delivered. If your competitor’s logo appears in 30% more content than yours despite equal sponsorship tiers, that’s a direct performance gap.
Competitive Benchmarking — Share of visual attention allows you to track your position against rivals across multiple events and geographies. Over time, these insights reveal which competitors are most effective at leveraging event media to dominate the visual landscape.
Negotiation and Strategy Leverage — Armed with quantified visibility data, your team can negotiate for better placement, higher prominence, or exclusive positions in future events — and justify these asks with evidence, not assumptions.
Historically, capturing this metric was labor-intensive, requiring teams to manually review and tag thousands of media files. Today, AI-powered visual analytics can process massive volumes of imagery in hours, detecting and categorizing every appearance of your brand and your competitors. This automation not only reduces operational cost but also delivers insights in time to adjust tactics for ongoing events.
In the modern sponsorship and event marketing arena, share of visual attention is no longer a “nice-to-have” — it’s a competitive intelligence asset. Companies that monitor it can course-correct in real time, while those that ignore it risk being visually outplayed without even realizing it.
Sources of Unstructured Visual Data at Events
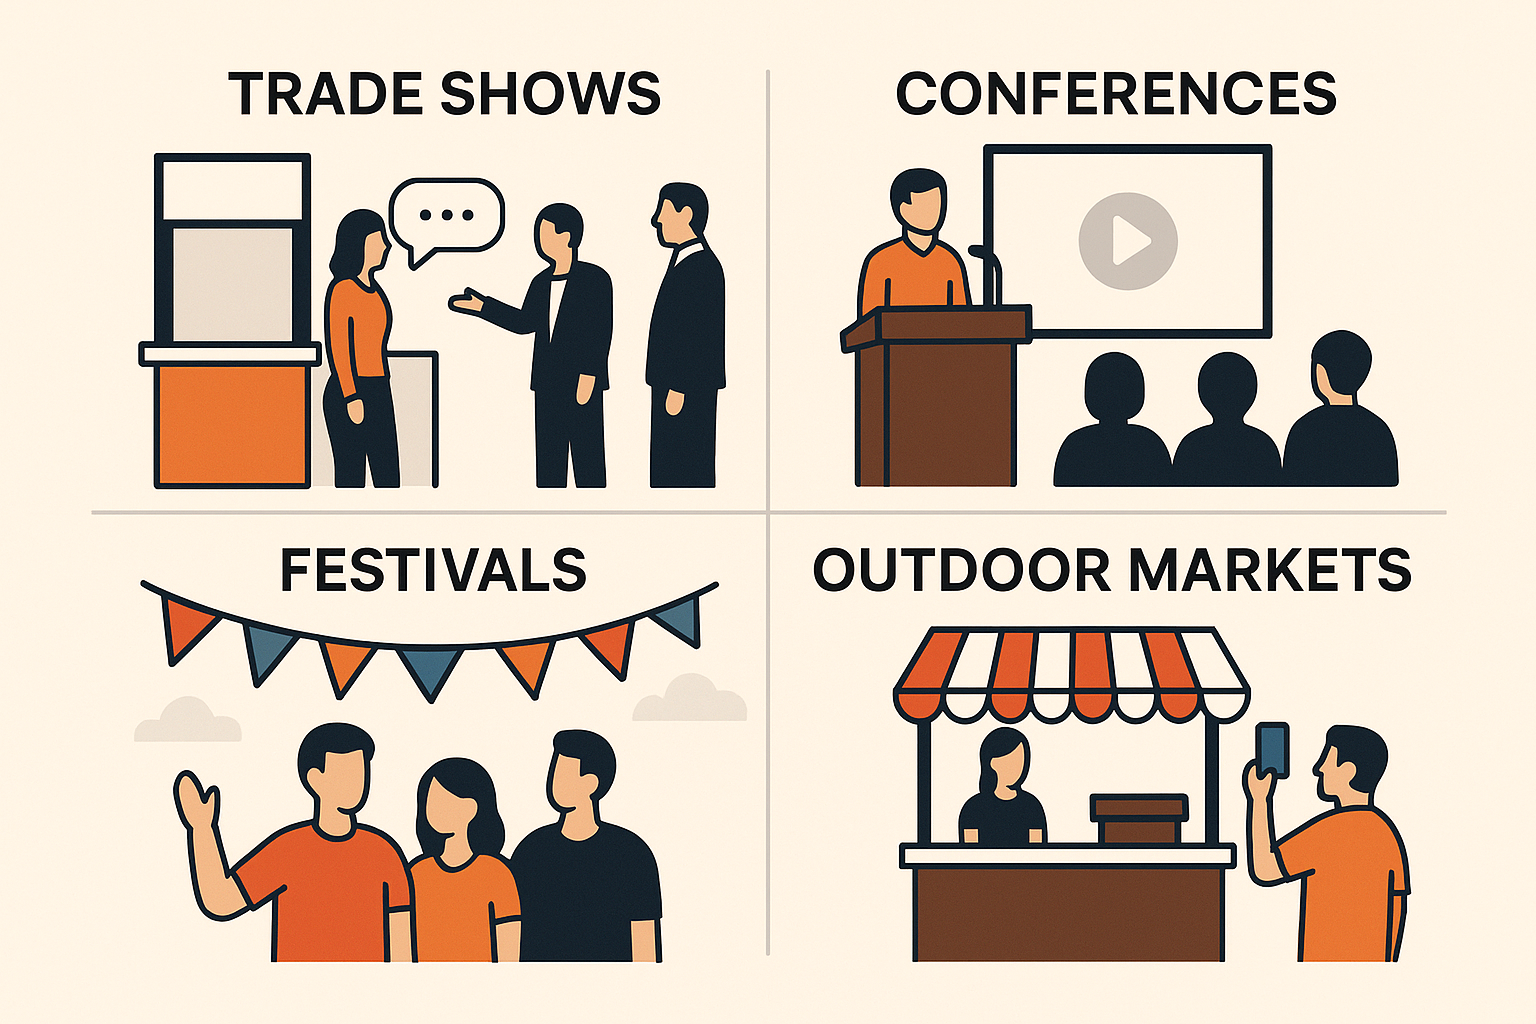
Every event generates a flood of visual content — much of it outside your direct control. This media comes from multiple sources, in different formats, and with varying degrees of quality. Collectively, it represents both a challenge to manage and a goldmine of competitive intelligence when analyzed effectively.
1. Official Event Photography and Videography
Organizers often commission professional photographers and videographers to document key moments, capture crowd energy, and showcase sponsor activations. These assets are polished and high-resolution, making them valuable for brand visibility analysis. However, because the content is curated, it may not fully reflect the real competitive landscape — certain angles or scenes may be omitted to align with event messaging.
2. User-Generated Content (UGC)
Attendees armed with smartphones are now some of the most prolific content creators. They post to Instagram, TikTok, LinkedIn, or Twitter/X, livestream from the floor, and share candid snapshots that often include unplanned brand appearances. Unlike official media, UGC is raw, varied, and uncontrolled — which means it frequently captures competitor logos in authentic, high-engagement moments that influence perception far beyond the event venue.
3. Influencer and Partner Coverage
Industry influencers, media partners, and affiliated organizations often share their own perspective of the event. These sources can amplify certain brands’ presence, especially if a competitor has secured an influencer partnership that guarantees logo or product visibility in their content.
4. News and Press Footage
Local and international media outlets may cover major events, creating video packages and photo galleries. This exposure often reaches audiences far larger than the in-person crowd, and competitor brands prominently featured in these segments can achieve significant visibility without additional spend.
The Challenge:
This content is unstructured — coming from multiple platforms, in different resolutions, shot from unpredictable angles, and often buried in massive volumes of data. Manually reviewing and cataloging it is slow, error-prone, and expensive.
The Opportunity:
AI-powered image processing tools can scan these vast archives, detect brand marks in any format, and deliver structured, actionable data. By tapping into all sources — from glossy PR shots to grainy attendee videos — companies can build a comprehensive map of competitor presence. This level of visibility enables more informed decisions on sponsorship investments, placement strategies, and competitive positioning.
In short, your competitors are likely already benefiting from these diverse media streams. The question is whether you’re analyzing them as thoroughly as they are.

How AI Transforms Event Footage into Competitor Insights
Until recently, measuring competitor presence in event media meant hours — sometimes weeks — of manual review. Teams had to sift through thousands of images and videos, tagging logos by hand and trying to piece together a visibility picture that was inevitably incomplete. Today, AI-powered visual intelligence eliminates these bottlenecks, delivering precise, scalable analysis that turns chaotic media libraries into strategic insight.
Logo and Brand Mark Recognition
The most critical capability is automated brand and logo detection. AI models can scan every frame of an image or video, instantly identifying where a logo appears, regardless of angle, lighting, size, or partial obstruction. Advanced algorithms can distinguish between similar brand marks, detect subtle color variations, and work across multiple contexts — from a banner on a stadium wall to a branded shirt in a crowded conference hall.
Object and Scene Context Detection
Recognizing the logo is only the first step. AI can also interpret where and how the logo is displayed. For example, it can differentiate between a logo on a primary sponsorship backdrop versus a small badge on a product display. This context reveals the quality of the exposure, not just the quantity, allowing marketing and sponsorship teams to assess whether their placement strategies are generating meaningful attention.
Text Recognition (OCR)
Some brand appearances are text-based rather than logo-based — think sponsor names printed on event programs, directional signage, or scrolling LED boards. Optical Character Recognition (OCR) enables the system to capture these appearances, even if the text is stylized or partially visible. This expands visibility tracking beyond graphic marks to include every possible brand reference.
Noise Reduction and Focus Enhancement
Event media is rarely clean. Crowds, clutter, poor lighting, and motion blur can make detection harder. AI can apply background removal and image labeling to isolate relevant visual elements, ensuring that the analysis focuses on brand-related content and filters out visual noise.
From Raw Media to Competitive Dashboard
The process is straightforward in concept but powerful in execution:
Ingest — Gather imagery and video from all relevant sources: official media, UGC, influencer posts, and press coverage.
Scan — Apply brand recognition, object detection, and OCR to identify every instance of competitor and owned branding.
Quantify — Aggregate appearances, categorize by exposure type and duration, and calculate each brand’s share of visual attention.
Visualize — Present the findings in dashboards and reports that executives can act on immediately.
Solutions like a Brand Recognition API make this process accessible without requiring in-house AI infrastructure. They offer fast deployment, scalable processing power, and the flexibility to integrate into existing analytics workflows — turning what was once a months-long manual process into a near-real-time competitive intelligence feed.
The result? Decision-makers no longer have to rely on anecdotal impressions or incomplete photo albums. They can see the full competitive visibility landscape and take action before the next event even begins.

Turning Insights into Action — Strategic Levers for Brand Teams
Collecting visibility data is only valuable if it leads to better decisions. Once AI-powered analysis has mapped out your share of visual attention — and your competitors’ — the next step is to convert those insights into strategic moves that improve ROI and competitive positioning. For brand, marketing, and sponsorship teams, this intelligence can reshape both event execution and long-term planning.
1. Placement Optimization
Not all visibility is equal. AI analytics can pinpoint exactly which locations — whether on stage backdrops, near high-traffic entrances, or along media interview corridors — generate the most consistent camera coverage. If competitor logos dominate in these hotspots, it signals where your brand should fight for presence in the next sponsorship negotiation. This data-driven approach replaces guesswork with evidence, making it easier to justify premium placement investments.
2. Sponsorship Negotiations
Visibility metrics create leverage. If your analysis shows a competitor gained significantly more media exposure despite similar sponsorship spend, you can present these numbers to event organizers as proof of imbalance. This can lead to renegotiated placements, additional visibility perks, or even reduced rates in future agreements. For C-level leaders, this translates directly into cost efficiency and improved ROI.
3. Competitive Playbooks
Understanding how competitors achieve high visual share — whether through guerrilla tactics like unofficial merchandise, influencer partnerships, or strategic positioning — allows your team to replicate or counter these moves. Over time, this becomes a repeatable competitive playbook, ensuring your brand stays at parity or ahead in the visibility race.
4. Event Selection and Portfolio Management
Not all events deliver equal value for your visibility dollar. By comparing visual attention metrics across different venues, formats, and geographies, you can focus budget on the events that consistently yield high-quality exposure. This portfolio approach ensures sponsorship and activation spend is concentrated where it matters most.
5. Budget Justification and Internal Alignment
C-level executives often need hard numbers to support marketing spend. Visual attention analytics provide clear, quantifiable evidence of impact — making it easier to secure budget for sponsorship renewals, creative activations, or expanded media rights. Just as importantly, this data can align marketing, sales, and brand teams around shared visibility goals.
The key advantage of modern AI-driven visibility tracking is speed. Insights can be generated during the event, not just after it, enabling teams to make in-the-moment adjustments — such as changing activation locations, deploying additional signage, or increasing influencer coverage — while the audience’s attention is still live.
By acting on this intelligence, brands can turn passive measurement into proactive competitive advantage. In the high-stakes environment of event marketing, that agility can be the difference between blending into the background and dominating the visual narrative.
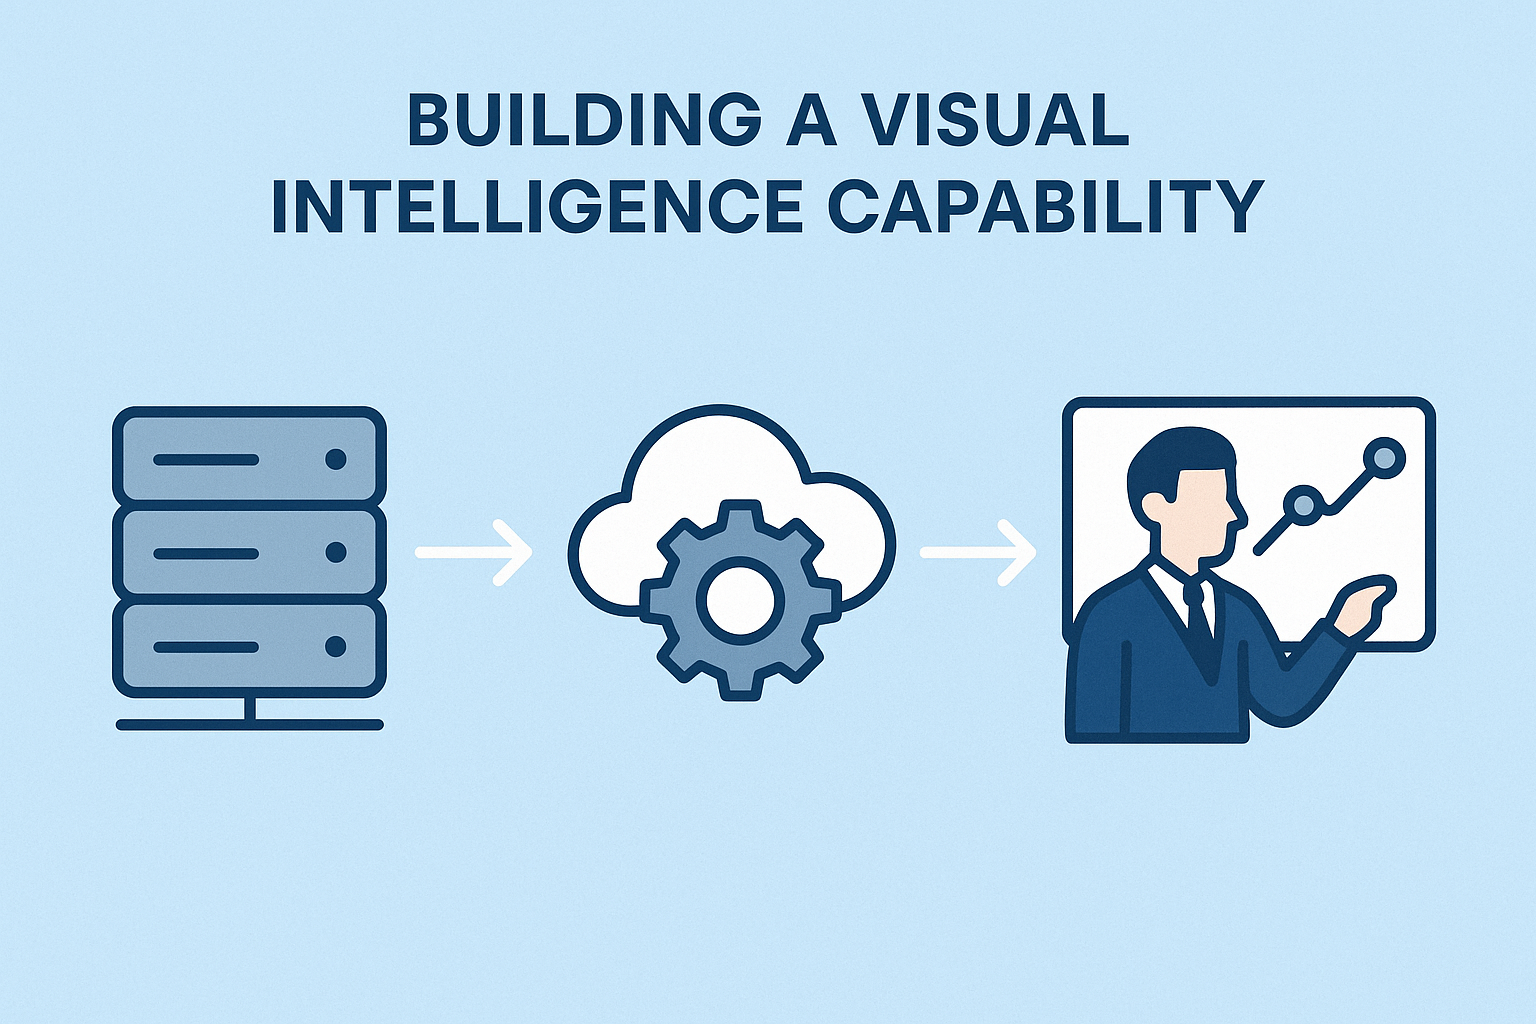
Building a Visual Intelligence Capability
The ability to analyze competitor presence in event footage is not just a one-off project — it’s a capability. When integrated into your marketing and sponsorship operations, it becomes a permanent competitive advantage, enabling data-backed decisions before, during, and after every event. Building this capability requires balancing technology, process, and governance.
1. Choosing the Right Technology Model
There are two primary approaches to establishing a visual intelligence function:
Cloud-Based AI APIs — Ideal for rapid deployment and scalability. These ready-to-use services can process thousands of images or hours of video with minimal setup. They are well-suited for teams that want to avoid infrastructure overhead and prefer a pay-per-use model. For example, a Brand Recognition API can instantly identify competitor logos across vast media libraries without in-house machine learning expertise.
Custom Computer Vision Solutions — Best for organizations with unique requirements, such as detecting highly specialized branding, operating under strict data governance rules, or integrating deeply into proprietary analytics platforms. While initial investment is higher, the solution can be tailored for extreme accuracy and competitive differentiation.
For many enterprises, the optimal strategy is a hybrid model — leveraging APIs for day-to-day analysis while developing custom modules for critical or sensitive use cases.
2. Embedding into the Decision-Making Workflow
Technology alone is not enough; insights must reach decision-makers in time to act. This means integrating the output of visual intelligence tools directly into:
Sponsorship ROI dashboards
Marketing performance reviews
Event planning playbooks
Competitive intelligence reports
The faster insights are surfaced, the greater the chance to make tactical adjustments — even mid-event.
3. Governance, Compliance, and Ethics
Analyzing public event media still demands attention to privacy and compliance. AI solutions should operate within clear legal frameworks, ensuring that personal identities are handled according to relevant regulations. Brand monitoring should focus on public and commercially shared imagery, avoiding any perception of overreach. Building these safeguards into the process not only mitigates risk but also strengthens stakeholder trust.
4. Cost Logic and ROI
C-level leaders should evaluate the capability as an investment with long-term payoff. While manual analysis may seem cheaper in the short term, it scales poorly and risks missed opportunities due to delayed insight. Automated, AI-powered analysis delivers faster intelligence, higher coverage, and greater accuracy — which, when applied to sponsorship negotiations, event selection, and brand positioning, can result in significant financial returns.
5. Preparing for the Real-Time Future
The next frontier is real-time visual intelligence, where competitor logo detection happens during livestreams or live broadcasts. Early adopters will be able to adjust placements, deploy supplemental assets, or push targeted social media content while the event is still unfolding — effectively competing for attention in the moment, not after the fact.
When built strategically, a visual intelligence capability is not just a tool — it becomes part of the organization’s competitive muscle memory, influencing every sponsorship decision and maximizing the value of every event appearance.

Conclusion — Winning the Battle for Eyeballs
In today’s event-driven economy, brand presence is no longer just about showing up. It’s about securing — and proving — a dominant share of audience attention. Competitor logos in event media are not incidental; they represent moments where your rivals claim visibility, shape perception, and potentially convert opportunities that might have been yours.
For years, organizations lacked the tools to measure this battlefield accurately. Decisions were based on instinct, selective observation, or post-event reports that barely scratched the surface. That era is over. AI-powered visual intelligence now enables businesses to quantify, compare, and act on brand visibility with the same precision they apply to digital ad performance or sales funnel analytics.
The takeaway for C-level leaders is clear:
If you don’t measure visual share, you can’t defend it. Competitors who track it will always have the upper hand in negotiations, positioning, and activation strategy.
If you don’t act on the insights, you’ll lose ground. The value lies not just in knowing where you stand, but in using that knowledge to reposition, renegotiate, and reallocate resources for maximum impact.
By integrating brand recognition, object detection, and OCR technologies into your marketing intelligence stack, you gain a persistent capability to see the entire competitive landscape — from glossy press photos to spontaneous attendee videos. This shifts event marketing from reactive storytelling to proactive visibility management.
The future will be even more dynamic. Real-time analysis will allow you to adjust tactics mid-event, outflank competitors before the closing ceremony, and transform brand visibility from a static outcome into an actively managed asset. Those who build this capability now will not only track the game — they’ll change it in their favor.
In a world where every shared image is a piece of competitive territory, winning the battle for eyeballs means knowing exactly what’s in the frame, and making sure your brand owns as much of it as possible.