Scoreboard OCR Meets Logo Metrics: Context Matters
Introduction — From “Screen Time” to “Impact Time”
Sponsors don’t buy minutes; they buy moments. Traditional logo reporting tallies how long a brand was on screen, but it ignores when those seconds occurred. A five-second exposure during a game-winning goal or a two-minute timeout when the camera lingers on pitch-side boards is worth more than the same duration in a low-stakes lull. That’s the gap “impact time” closes: by fusing live scoreboard context (score changes, period/half, time remaining, penalties, power plays, VAR moments) with logo visibility, you graduate from generic exposure to exposure that aligns with peak audience attention and emotional intensity (ResearchGate).
Why this matters now: executive teams are doubling down on sports even as many admit their sponsorship ROI signals are still fuzzy. Independent analysts note that brands plan to increase sponsorship investment while struggling to prove returns — exactly the moment to evolve measurement from quantity to context-rich quality. Two concise reads worth scanning: Forrester’s take on the paradox of rising spend vs. measurement gaps, and Deloitte’s 2025 outlook on data-driven sponsorships.
What “scoreboard OCR meets logo metrics” actually does: computer vision reads the broadcast scoreboard — numbers and status cues — from the live feed (or a small auxiliary camera pointed at the scoreboard). In parallel, logo-recognition tracks every on-screen brand, calculating their size, clarity, position, and duration. When you align these two streams, you can tag each exposure with a moment type (goal at 72:13, penalty at 31:02, two-minute timeout, buzzer-beater) and weight it accordingly. The result is an “impact-adjusted” view of Visual Share of Voice and Exposure Seconds that better supports pricing, packaging, make-goods, and revenue forecasts.
Executive takeaway: elevating logo analytics with scoreboard context gives commercial teams a common language for value. It helps justify rate cards (“premium if visible during scoring plays”), optimize inventory (which angles and assets dominate in decisive moments), and de-risk renewals with credible, audit-ready evidence. As you scale, you can implement this with off-the-shelf OCR and logo-recognition components and, when warranted, add custom rules for your league’s nuances, virtual ads, or multi-camera workflows — turning plain screen time into the kind of impact time sponsors will pay for.
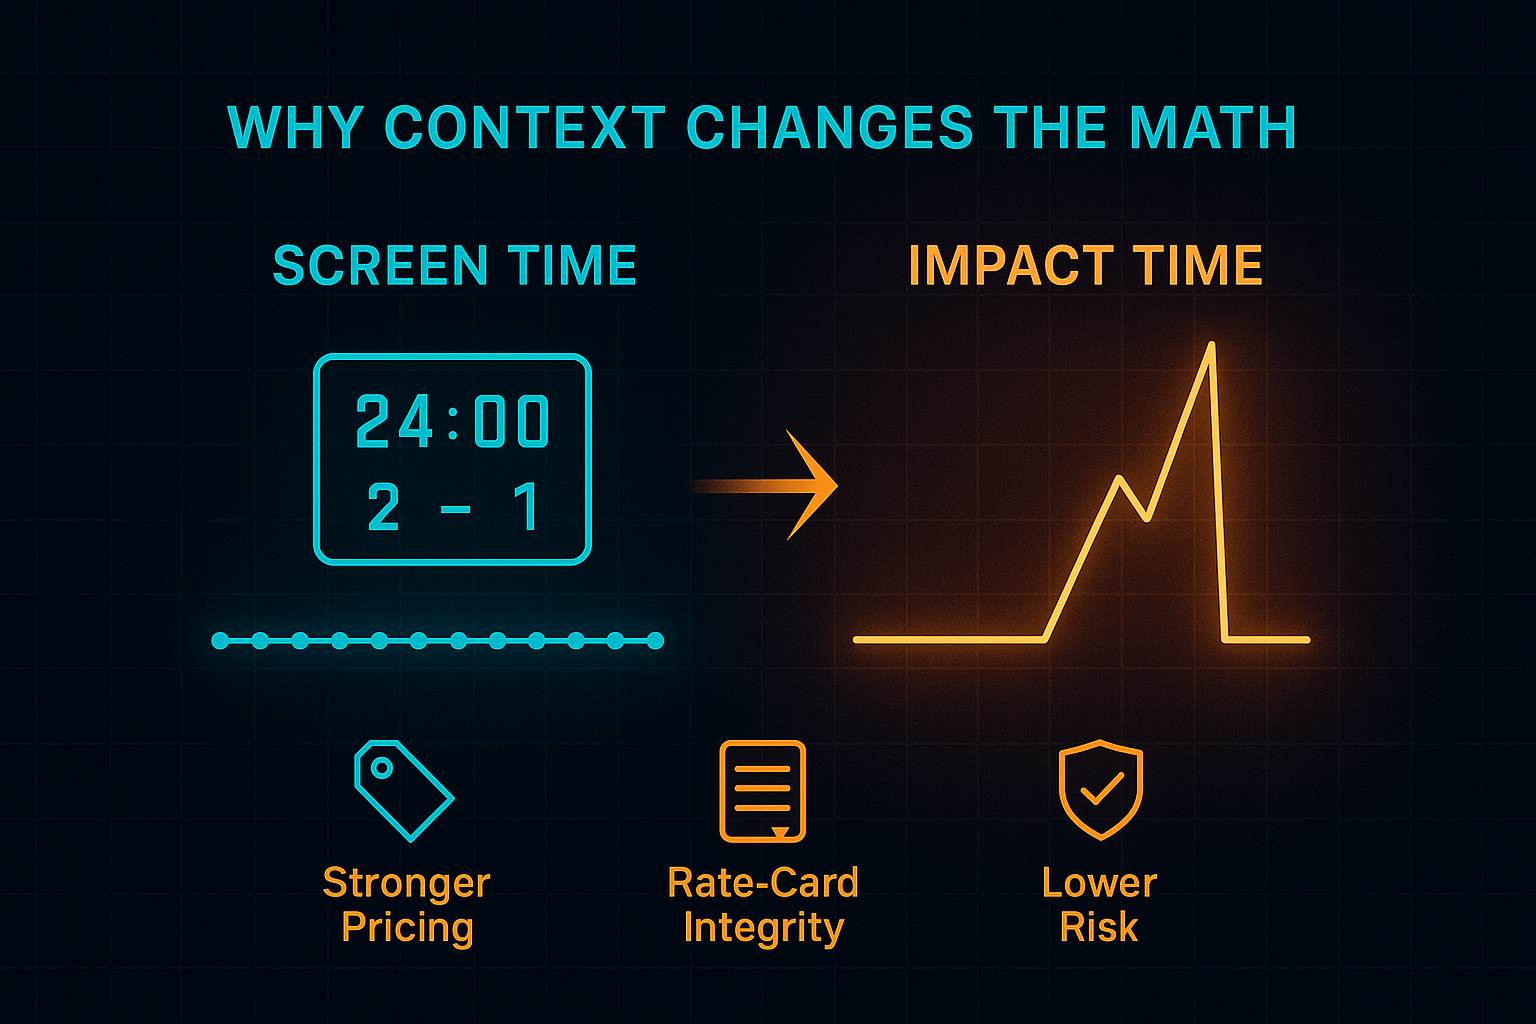
Why Context Changes the Math (Business Case)
When a logo is visible at the very moment attention spikes — a goal, a buzzer-beater, a power play, a VAR check — those seconds are simply worth more than the same duration in a quiet midfield pass. That’s the core business shift: moving from undifferentiated “screen time” to impact-adjusted time that prices exposure by when it happens. Industry outlooks consistently flag rising sponsorship spend alongside persistent ROI pressure; context-rich measurement is how rights-holders, agencies, and sponsors close that gap.
What changes for the P&L
Pricing & yield management: With impact-adjusted seconds, you can justify premiums for assets that dominate during decisive moments (e.g., center-frame LED during goals) and introduce tiered packaging like “scoring-moment bundles.” This reframes negotiations from minutes purchased to moments delivered, improving rate-card integrity and renewal leverage.
Portfolio allocation: Comparing assets by impact-adjusted CPeS (cost per exposure second) helps shift spend toward cameras, angles, and placements that concentrate high-value moments, not just total duration — raising effective ROAS of sponsorship inventory without adding broadcast time. Deloitte
Risk & make-goods: If a star player is injured or a match turns uneventful, you still know exactly what “impact” your sponsors received and can offer precise, audit-ready make-goods. That reduces friction and protects margin in variable seasons.
Forecasting & sales enablement: Impact curves (minute-by-minute context-weighted exposure) become inputs for demand forecasting and sales playbooks — what to pitch, to whom, at what premium — anchored in evidence, not anecdotes.
Growth segments: Fast-growing properties (e.g., women’s sports) bring fresh audiences and surging commercial interest; context-aware valuation helps price these assets credibly as they scale.
Why the math is different
Traditional reporting treats every second the same. In reality, audience attention is uneven — it spikes during outcomes and lingers during stoppages. By reading the live scoreboard (score changes, clock, period, penalties/timeouts) and linking it to logo visibility, you convert raw Exposure Seconds into Impact-Adjusted Exposure Seconds = Screen Time × Quality Weighting × Context Multiplier. That single idea unlocks clearer pricing, cleaner comparisons across games and leagues, and stronger board-level narratives about value creation.
What it takes (without boiling the ocean)
Technically, you’re combining two mature capabilities: scoreboard OCR (to extract time/score/state) and logo recognition (to quantify size, position, duration, clarity). Start with off-the-shelf APIs for speed; add custom rules later for league nuances, virtual ads, or multi-camera sync. Commercially, this keeps time-to-value short while giving you a roadmap to proprietary differentiation once KPIs are proven.
Further reading
Deloitte’s 2025 Sports Industry Outlook — why data-driven sponsorship valuation is moving center stage.
Nielsen’s 2025 Global Sports Report — growth drivers and the measurement implications for brands and rights-holders.
Bottom line for executives: context doesn’t add noise — it adds priceable signal. Linking scoreboard moments to brand visibility turns sponsorship from “minutes on screen” into a moment-based product that commands premiums, reallocates spend to higher-yield assets, and reduces downside risk when games don’t break your way.

Scoreboard OCR at a Glance (No Jargon, Just What It Does)
Plain-English definition. Scoreboard OCR is a camera-based way to read the scoreboard directly from the broadcast video — the game clock, score, period/half/inning, and status flags like penalties or power plays. In parallel, a logo-recognition service tracks which brands are visible on screen, for how long, how large, and how clear. Fuse the two streams and every exposure can be labeled with what was happening in the game at that second — turning raw screen time into impact time that better explains sponsorship value.
Where it runs. You can deploy this in a production truck, in the cloud, or in a hybrid setup. Practically, it’s just one additional “input” in the pipeline: either a cropped region of the program feed where the score bug lives, or a small auxiliary camera pointed at the physical scoreboard. Many streaming/broadcast tools already support OCR-based scoreboard overlays, so you’re not inventing a new workflow. See a straightforward example from Spiideo’s documentation on scoreboard overlay with OCR (their help page shows exactly how OCR keeps the on-screen score in sync with the venue board).
How it connects to the rest of your stack.
Logo metrics. Pair the OCR stream with multi-logo detection to compute exposure seconds, Visual Share of Voice, and quality factors (size, centrality, occlusion, sharpness). Off-the-shelf options include an OCR API for the scoreboard read and a Brand Mark & Logo Recognition API for the logos; these can be swapped for a custom model later if your league or broadcast graphics have unique quirks.
Resilience with data feeds. When venues provide structured scoreboard data (e.g., via Sportzcast/Scorebot devices), you can use that feed alone — or run it alongside OCR for redundancy and cross-checks (clock cadence, legal score transitions, period changes). Genius Sports (Sportzcast) outlines the “scoreboard data” route commonly used to drive broadcast graphics and in-venue displays.
What makes it reliable.
Predictable region + predictable rules. The scoreboard area is tiny and high-contrast, and the numbers follow strict rules (clocks count down, scores only increment, period/half transitions follow a known order). These constraints allow lightweight validation that dramatically reduces misreads.
Latency under control. Reading a small cropped region and smoothing with simple checks typically fits within live-production latency budgets. If official feeds are available, use them as a first source and keep OCR as a real-time safety net.
Fail-gracefully design. If a glare, graphic wipe, or replay occludes the score bug, the system can carry forward the last valid state briefly, alert an operator, or fall back to the data feed until OCR is confident again.
What you get business-wise.
Every brand exposure becomes moment-aware: “Logo X visible during the equalizer at 72:13” or “Logo Y dominated during a two-minute timeout.”
Sales can package moment bundles (e.g., scoring-plays only) and justify premiums with audit-ready evidence.
Ops get make-good precision when games turn quiet: you can see exactly what impact was delivered and compensate accordingly.
Strategy teams model impact-adjusted CPeS and vSOV by moment type to reallocate spend toward placements that consistently show up in decisive moments.
Executive takeaway. Scoreboard OCR is not a moonshot — it’s a practical add-on that slots into existing broadcast workflows and pairs naturally with logo analytics. Start with ready-to-use OCR and logo APIs to prove the KPI story quickly; add custom rules for your league’s timing conventions, virtual ads, or multi-camera sync once the business case is clear. The result is a measurement language your sponsors understand — moments, not minutes — and a cleaner path to premium pricing.

Linking Plays to Logos — The Fusion Pipeline
What you’re building: a single timeline that knows both which brands were visible and what the game was doing at that moment. Below is the end-to-end flow, written for speed to value and auditability.
1) Ingest the video and “read” the scoreboard.
A tiny cropped region of the program feed (or a small auxiliary camera pointed at the physical board) is passed through OCR to capture clock, score, period/half and status flags (e.g., power play, timeout). Many live-production stacks already support OCR-driven overlays, so this step slots into existing workflows rather than reinventing them. For a practical reference, see Spiideo’s guide to scoreboard OCR overlays.
2) Detect and track every logo.
Frame by frame, a logo-recognition service identifies brands on LED boards, jerseys, and virtual ads, then tracks their on-screen area, centrality, sharpness, and occlusion over time. Out of the box, this is where ready-to-use APIs shine (e.g., Brand Mark & Logo Recognition for breadth of brand coverage). As quality rises, you can tune detection thresholds and add sport-specific rules without re-architecting the pipeline.
3) Synchronize to one canonical clock.
Normalize timestamps across feeds (program feed, iso cameras, scoreboard crop). Use the scoreboard clock as ground truth; implement simple sanity rules (scores only increase, periods change in known sequences) to smooth short OCR hiccups during wipes or replays. If a venue exposes an official scoreboard data feed (e.g., Sportzcast/Scorebot), fuse it for redundancy and cross-checks.
4) Tag “moments” automatically.
An event engine converts scoreboard changes into labeled moments: goals at exact timestamps, penalties issued, timeouts called, end-game crunch time, VAR reviews, power plays. These tags become the anchors that transform generic screen time into impact time.
5) Weight exposure by context, not just quality.
Start from a familiar formula — Exposure Seconds × quality factors (size, position, clarity) — and add context multiplierstied to the tagged moments. Examples: scoring plays ×3, final 5 minutes ×2, timeouts ×1.5, penalties ×1.5. This keeps the math legible for sponsors while reflecting real attention spikes.
6) De-duplicate across cameras and overlays.
Live shows cut between angles and mix in graphics. Ensure each second of exposure is counted once: merge overlapping detections by brand, prioritize the clearest instance, and drop replay duplicates unless your commercial model prices replays separately.
7) Roll up to executive-grade KPIs.
Impact-Adjusted Exposure Seconds: the cornerstone metric for value conversations.
vSOV by moment type: which brands truly dominated during goals, timeouts or penalties.
CPeS (impact-adjusted): cost divided by impact seconds for apples-to-apples comparison across games and assets.
Storytelling artifacts: a minute-by-minute impact curve with moment markers, plus a broadcast-frame heatmap showing where high-value exposures cluster.
8) Governance, privacy, and trust.
Keep latency budgets tight by processing only the scoreboard crop and logo ROIs. Log every decision (OCR read, event tag, multiplier applied) for auditability and make-goods. If you store footage, apply Image Anonymization to faces and plates to align with privacy policies — especially for long-tail archives and highlights distribution.
How to get started fast.
Pilot with ready-to-use OCR and Logo Recognition APIs on a single team or production truck. Prove the uplift in pricing and make-good accuracy over 3–4 matches. Then layer in custom rules (league-specific timing, virtual ad treatment, multi-camera sync, or bespoke multipliers) once the business case is clear.
Executive takeaway: this pipeline doesn’t chase perfection — it creates a shared language of moments that commercial teams, agencies and sponsors recognize and can price. By uniting scoreboard events with logo exposure, you turn minutes into meaning, and meaning into margin.

The Executive Metrics That Matter (and How to Present Them)
C-level decisions need metrics that survive the boardroom test: auditable, comparable, and clearly tied to revenue. When scoreboard OCR is fused with logo analytics, you can move beyond undifferentiated “screen time” to a concise set of impact-aware KPIs your commercial, finance, and rights teams can all stand behind.
Impact-Adjusted Exposure Seconds (IAES).
This is the foundation. Start with on-screen duration and weight it by quality (size, placement, clarity, occlusion) and context (scoring plays, timeouts, penalties, crunch-time). The quality component mirrors established sponsorship-valuation practice (e.g., Nielsen’s Quality Index, which weights exposures by factors like size, location and duration), while the context multiplier reflects when attention spikes. Present IAES as a single headline number per brand, per match, and as a minute-by-minute chart with goal/penalty markers for an intuitive narrative.
Visual Share of Voice (vSOV), filtered by moment type.
Executives know “share of voice”; vSOV is the on-screen version. Show who truly dominated visibility during decisive moments (e.g., “vSOV in scoring plays”) versus the full match. This unlocks premium packaging (“scoring-moment bundles”) and clarifies which assets and camera angles consistently deliver high-value presence rather than just long totals. For additional context on sponsorship KPIs beyond raw exposure, see an overview of common metrics used in the industry.
CPeS (Impact-Adjusted Cost per Exposure Second).
Translate value into a pricing language finance can model: CPeS = spend / IAES. This normalizes assets and games, supports rate-card integrity, and enables apples-to-apples benchmarking across leagues, placements, and partners. Position CPeS next to existing media buying models (e.g., CPM/CPV) to show why “paying for moments” is more transparent than paying for impressions that may not coincide with attention spikes.
Lift markers (optional, when available).
Where you have access to downstream signals — search queries, app opens, social spikes — overlay those time series onto the IAES chart to illustrate correlation around big plays. These aren’t always available in real time, but when they are, they strengthen the board-level story that contexted exposure drives outcomes, not just visibility.
How to present this in 3 visuals that sell the story.
Impact curve: a minute-by-minute line showing IAES with event markers (goals, penalties, reviews). It makes the “moments, not minutes” point instantly.
Moment-filtered vSOV leaderboard: rank brands only during scoring plays and late-game windows; this is your premium-pricing slide.
Frame heatmap: where on the broadcast frame high-value exposures cluster (center vs. corners), guiding future asset and camera-angle investments.
Governance and trust signals executives expect.
Audit trail: keep a log of scoreboard reads, event tags and multipliers applied; this reduces dispute time in make-goods.
De-duplication policy: count each second once across cameras and replays unless your pricing explicitly values replays.
Benchmarking rules: align with accepted quality-weighting practices (again, think Quality Index-style factors) so external partners recognize the methodology.
Executive takeaway.
With IAES, moment-filtered vSOV, and impact-adjusted CPeS on a single page, you replace “minutes on screen” with a moment-based value system. It defends pricing, reallocates spend to higher-yield placements, and shortens negotiations — because you’re selling what sponsors actually want to buy: credible exposure at the moments that matter most.

Implementation Paths — APIs First, Custom Where It Pays Off
The executive play: prove the KPI story fast with off-the-shelf building blocks, then invest in a few custom pieces where they create durable advantage. This keeps time-to-value short, reduces delivery risk, and preserves the option to differentiate later.
Start with modular APIs (30–60 days to proof).
Scoreboard reading: use a ready OCR service to capture clock, score, period/half, and status flags from a small crop of the broadcast feed. If the venue exposes an official scoreboard feed (e.g., devices that relay controller data), wire it in alongside OCR for redundancy and smoother latency. This dual-source approach is standard in live sports tooling and lets you fail over seamlessly during wipes or replays.
Logo analytics: plug in a multi-logo recognition API to quantify brand exposures (size, position, clarity, duration) across LED boards, jerseys, and virtual ads.
Fusion & KPIs: align the two streams on a single timeline, auto-tag moments (goals, timeouts, penalties), and publish Impact-Adjusted Exposure Seconds (IAES), moment-filtered vSOV, and impact-adjusted CPeS to a lightweight dashboard.
Data governance: log OCR reads, tags, and multipliers for auditability; apply image anonymization to stored footage for privacy compliance.
Scale & harden without boiling the ocean.
Latency budgets: keep processing confined to the scoreboard crop and logo regions to meet live-production constraints.
Reliability: run OCR and official feeds in parallel, with simple sanity rules (scores only increase, period transitions are known).
Deduplication: count each second once across cameras and replays unless your pricing model charges for replays.
Ops visibility: add alerting for OCR confidence drops, missing feeds, or clock mismatches.
Where custom work pays off (build selectively).
League-specific logic: bespoke context multipliers (e.g., special value for power plays, VAR, stoppage-time equalizers) and moment definitions that match your commercial model.
Virtual ad handling: rules for distinguishing physical versus virtual placements and how to price them.
Multi-camera synchronization: precise timing across program/ISO feeds when you want moment-by-moment vSOV at the camera-angle level.
Commercial workflows: integrations with rights management, rate-card systems, ad ops, and make-good automation.
TCO logic you can defend.
Why “APIs first”: you avoid GPU capex, model maintenance, and MLOps overhead while you validate that moment-based metrics improve pricing and renewals.
When to “build”: once the KPI uplift is proven, target the 10–20% of functionality that’s uniquely yours — league quirks, premium packaging rules, or latency-critical edge pieces. Contemporary guidance on AI operating models echoes this: leaders get the best returns when they move beyond a binary build-versus-buy stance and combine commodity components with focused proprietary layers.
How this maps to available products today (non-exhaustive).
OCR for the scoreboard to capture the context stream.
Brand Mark & Logo Recognition to track multi-brand exposure at scale (helpful for long-tail sponsors).
Object Detection / Image Labelling to classify ad surfaces and camera angles.
Image Anonymization to keep archives privacy-safe.
These API blocks let you stand up a pilot quickly; if your league, broadcast graphics, or virtual ads create edge cases, a tailored solution can lock in performance and cost advantages over time.
Pilot blueprint (the low-risk path).
Pick one team or production truck; ingest 3–5 matches.
Stand up OCR + logo analytics; fuse into IAES, moment-filtered vSOV, and impact-adjusted CPeS.
Present a single-page executive readout with impact curves and a “scoring-moments only” leaderboard.
Compare pricing outcomes and make-good disputes pre- vs post-pilot; decide where custom work will compound gains.
Bottom line: treat scoreboard OCR, logo recognition, and anonymization as commodity rails you can rent on day one. Invest engineering only where it raises prices, cuts dispute time, or unlocks unique packaging. If your venues also expose official scoreboard data, run it alongside OCR from the start — you’ll gain resilience and smoother operations as you scale.

Conclusion — Make Every Second Tell a Story
The sponsorship market is rewarding rights-holders and brands that move from minutes to moments. By pairing scoreboard OCR with logo analytics, you translate plain screen time into impact-adjusted exposure — a common language that finance, sales, and partners trust. In practice, that means defending rate cards with Impact-Adjusted Exposure Seconds (IAES), packaging moment-filtered vSOV for premium buys, and benchmarking with impact-adjusted CPeS so every asset can be priced — and compared — on outcomes, not anecdotes. This is exactly where industry outlooks say the business is heading: more data-driven, more defensible, and more performance-based.
Your 90-day path to proof. Start small: one team or one production truck, three to five matches. Use OCR on the scoreboard region, run multi-logo detection, and fuse the streams on a single timeline. Publish one executive page per match: an impact curve with goal/penalty markers, a “scoring-moments only” vSOV leaderboard, and the impact-adjusted CPeS comparison. Keep an audit log of reads, tags, and multipliers to simplify make-goods. Where available, run an official scoreboard feed in parallel for redundancy. If the results show higher yield, expand to more venues and add bespoke rules for your league’s high-value moments.
Why this is low risk and high leverage. You can stand up the pipeline with off-the-shelf building blocks — OCR for the scoreboard, Brand Mark & Logo Recognition for exposures, Image Anonymization for stored footage — and layer in custom logic where it truly creates advantage (virtual ad handling, multi-camera synchronization, or league-specific multipliers). As you scale, align reporting with established sponsorship-valuation practices (quality weighting, consistent taxonomies) to keep third-party stakeholders on side. Industry frameworks around media valuation (e.g., Nielsen’s approach) make these conversations faster and fairer.
Executive takeaway. Context turns visibility into value. Linking logo exposure to goals, timeouts, and penalties doesn’t just improve measurement — it reshapes the product you sell: premium, moment-based inventory backed by audit-ready evidence. The practical next step is a focused pilot that proves pricing lift and dispute reduction — then a measured rollout that blends ready-to-use APIs with targeted custom development for durable differentiation.