Turning Store Traffic Footage into Marketing Insights
Introduction – From “Headcount” to High-Fidelity Shopper Insight
For years, in-store cameras were mostly used to count how many people walked through the door. This basic “people counting” helped with staffing decisions and daily footfall reports — but it left a lot of important questions unanswered. What did customers look at? Which displays caught their attention? How long did they spend deciding between two products? In short, traditional video analytics told us how many, but not how they behaved.
Today, that’s changing.
Thanks to rapid advances in computer vision, in-store footage can now reveal deep, real-time insights about customer behavior — far beyond simple counting. Cameras powered by smart vision algorithms can detect not only where people go but also what they interact with. These systems can recognize when someone stops in front of a shelf, picks up a product, studies it, returns it, or puts it in their basket.
This level of behavioral visibility is a game-changer for retail. It brings brick-and-mortar stores closer to the kind of detailed customer journey tracking that e-commerce platforms have had for years. Just like online retailers analyze click-through rates, dwell times, and bounce rates to optimize their product pages, physical stores can now optimize their layouts, displays, and signage based on what actually happens on the floor — not just guesswork or post-sale data.
This blog post explores how modern vision technologies are turning store video footage into powerful marketing insights. We’ll look at the technologies behind it, real use cases, and practical strategies to make the most of these capabilities. You’ll also see how off-the-shelf computer vision APIs — like those for object detection, face anonymization, and brand recognition — can help you launch smarter, data-driven experiments in your retail space without heavy investment in AI development.

Footfall → Engagement: Mapping the Real-World Customer Journey
Counting how many people enter a store is useful — but it’s just the beginning. What retailers truly need to understand is what customers do once they’re inside. This is where modern video analytics shines: it allows stores to map the entire in-store customer journey, from the moment someone enters to the moment they make a purchase (or leave without one).
Instead of focusing only on foot traffic, smart camera systems now measure engagement. This means tracking moments like:
How long a person stands in front of a display.
Whether they pick up a product.
If they turn the item around to read the label.
Whether they place it back on the shelf or take it with them.
These subtle actions reveal valuable insights about interest and intent. For example, if a display attracts a lot of attention but few conversions (people walking away without taking anything), it could mean the pricing isn’t right, the message is unclear, or the product placement needs work.
To enable this level of understanding, several computer vision techniques are used together:
Object detection identifies people, shelves, and products in each frame.
Pose estimation analyzes body language and hand movements to detect gestures like reaching or picking up.
Tracking algorithms follow individual shoppers across frames while keeping their identities private.
Dwell time analysis calculates how long someone stays in a specific area or looks at a certain object.
These tools combine to create a rich picture of how shoppers move and interact in the store. Instead of just knowing that 1,000 people came in on a Saturday, you now know that 250 of them stopped at the new beverage display, and 80 picked up a bottle — insights that directly inform layout decisions, promotions, and staffing.
Here’s a simple example: imagine testing two versions of a product display. One version uses a horizontal layout; the other stacks products vertically. By using vision analytics to compare how long customers interact with each version — and how many end up making a purchase — you can clearly see which design works best, without relying on surveys or gut instinct.
In short, modern camera systems are becoming powerful behavior-mapping tools. They transform everyday footage into data that helps retailers fine-tune their stores, boost product visibility, and increase conversion rates — just like A/B testing on an e-commerce site.
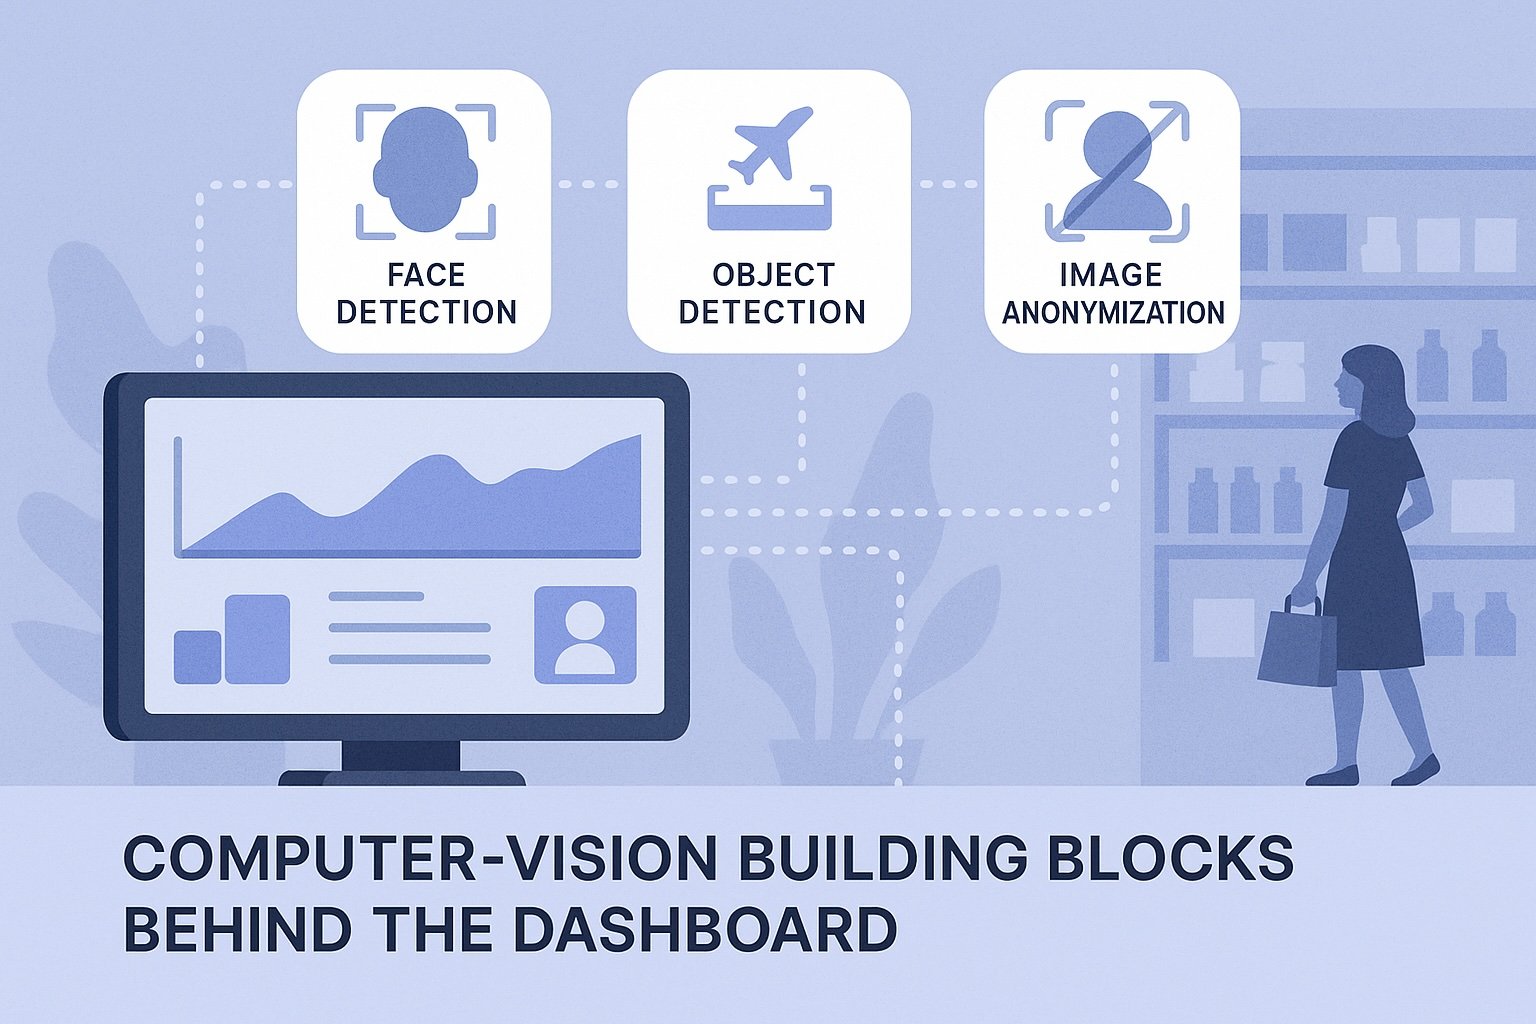
Computer Vision Building Blocks Behind the Dashboard
Behind every smart in-store insight is a well-designed computer vision pipeline. While the final output might look like a simple dashboard showing heatmaps or dwell time charts, there’s a lot happening in the background to turn raw video footage into useful marketing data. Let’s break down how this process works, step by step.
Step 1: Capturing and Sampling Video Frames
Cameras installed in the store continuously record video. But instead of analyzing every frame in real-time (which would be expensive and unnecessary), the system selects key frames at regular intervals — say, every half-second or second — for processing.
Step 2: Detecting People and Products
Each selected frame is processed by object detection models, which identify key elements:
People (shoppers, employees)
Shelves and displays
Individual products or product categories
Brand logos or packaging patterns
Ready-to-use APIs like API4AI’s Object Detection, Furniture & Household Item Recognition, and Brand Mark Recognition APIs can do this reliably, saving development time and cost.
Step 3: Tracking Movement and Actions
After detecting people, the system applies tracking algorithms to follow each shopper across multiple frames. This allows it to measure movement through the store, even if the shopper is partially occluded or moves quickly.
More advanced models add pose estimation, which looks at body posture and hand movement. This makes it possible to detect actions like:
Reaching toward a product
Picking something up
Placing it in a basket
Returning it to a shelf
With this level of detail, stores can measure not just presence, but interaction — which is much more valuable.
Step 4: Extracting Events and Metadata
As actions are detected, the system logs them as events — like “shopper picked up a bottle at shelf A at 12:34 PM.” These events are structured into machine-readable data (often JSON) and stored in a database for reporting and analysis.
For privacy and compliance, face anonymization is applied to all footage using tools like API4AI’s Image Anonymization API, ensuring GDPR and other data protection rules are followed.
Step 5: Analytics and Visualization
Once enough events are collected, the data is processed to create:
Heatmaps of where people stop most often
Dwell time stats by product or zone
Interaction funnels (approach → inspect → purchase)
Comparisons between displays, times of day, or customer segments
These are the kinds of insights merchandisers and marketers can act on — without having to manually review hours of footage or rely on surveys.
Plug-and-Play vs. DIY
While it’s possible to build such a system from scratch using open-source tools, many retailers prefer to speed things up by using cloud-based vision APIs. These pre-trained models handle the heavy lifting and can be integrated with just a few API calls. Services like API4AI offer a wide range of models tailored to real-world image analysis tasks — from detecting products to identifying brand logos or anonymizing faces.
By using these building blocks, retailers can focus less on model training and more on running experiments, improving layouts, and measuring success.
In summary, what seems like a simple insight on a dashboard — like “shoppers spent 3.4 minutes in the beverage aisle today” — actually comes from a sophisticated pipeline powered by smart vision models. The good news? You don’t need a data science team to get started — many of these tools are available off the shelf and easy to integrate.
Pixels to Planograms: Rapid Layout Experiments Without Clipboards
In the past, understanding how well a store layout worked meant walking the floor with a clipboard, observing shoppers by hand, or waiting weeks for sales reports to hint at what went wrong. But now, with computer vision tools analyzing customer behavior in real time, layout decisions can be made faster, smarter, and based on actual engagement data — not assumptions.
Visualizing Shopper Behavior with Heatmaps
One of the most powerful tools in modern in-store analytics is the heatmap. It shows where customers spend most of their time, using color-coded zones layered over the store layout.
Hot zones (usually red or orange) indicate high foot traffic or long dwell times.
Cold zones (blue or green) show areas customers tend to avoid or walk past quickly.
By studying these heatmaps, merchandisers can easily identify:
Which displays are drawing attention.
Which aisles are being ignored.
Whether key promotional zones are working as intended.
This insight allows teams to tweak placements and instantly measure results — no waiting for end-of-month sales numbers.
A/B Testing in the Physical World
Just like e-commerce websites run A/B tests on page layouts, retailers can now run real-world layout experiments.
For example:
Try two versions of a product display (e.g., pyramid vs. flat layout) in similar locations across different stores or days.
Use video analytics to compare which version keeps customers engaged longer or leads to more product interactions.
Track not only traffic but what actions people take — such as picking up items or placing them into baskets.
This approach gives merchandisers evidence-based feedback on layout choices within days instead of weeks.
Dynamic Store Design Based on Live Feedback
With real-time analytics, stores can even begin experimenting with dynamic layouts:
Adjust product displays during slow hours based on morning shopper patterns.
Swap signage, shelf positioning, or product groupings mid-day if engagement drops.
Rotate promotional zones based on what heatmaps show is catching attention that week.
This kind of responsive, data-backed design was once only available in online retail. Now, thanks to camera intelligence, brick-and-mortar stores can be just as agile.
Augmenting Digital Signage with Behavior Triggers
Vision-based systems also unlock smarter digital signage strategies. If a shopper stops for several seconds in front of a display, a screen nearby might trigger a short product video, a discount offer, or a comparison chart.
Even better — content can adapt based on:
Time spent in front of the display
Direction of gaze
Detected product interest
By tying engagement data to signage content, retailers can transform passive displays into active selling tools.
In summary, modern camera-based analytics tools allow store teams to stop guessing and start testing. Whether it’s refining a shelf layout, repositioning slow-moving products, or designing new end caps, every change can now be backed by behavioral data. The result? Fewer missed opportunities, better in-store experiences, and more confident merchandising decisions.

Edge, Cloud, or Hybrid? Deployment Strategies That Respect Bandwidth & Privacy
Turning in-store footage into useful insights is powerful — but it also comes with important technical and legal decisions. One of the biggest choices retailers face is where to process the video data: on the edge (locally), in the cloud (remotely), or using a hybrid approach that combines both.
Each option has pros and cons, depending on your store size, internet connection, privacy concerns, and budget. Let’s walk through them.
Edge Processing: Fast, Private, and On-Site
Edge computing means analyzing video data directly on-site, using a small local device (like an edge AI box or a powerful camera with built-in processing).
Benefits:
Low latency: Results (like detecting a shopper picking up a product) are available almost instantly.
Privacy-first: Since video doesn’t need to leave the store, it’s easier to stay compliant with GDPR or other regulations.
Reduced bandwidth: No need to upload large video files to the cloud.
Use cases:
Real-time alerts (e.g. “a shopper is browsing the fragrance display for more than 30 seconds”).
In-store screen triggers that respond instantly to behavior.
Challenges:
Limited compute power compared to the cloud.
Requires maintenance of local devices in each store.
Cloud Processing: Scalable and Centralized
Cloud-based processing means video frames or metadata are sent to a remote server (often hosted by a cloud provider) where powerful AI models analyze them.
Benefits:
Scalable: Ideal for large retail chains with hundreds of locations.
Centralized learning: Data from multiple stores can be used to improve models and detect trends.
Less local hardware needed: Stores only need simple IP cameras and a stable internet connection.
Use cases:
Multi-store reporting dashboards.
Advanced analysis like cross-store benchmarking or seasonal behavior modeling.
Challenges:
Bandwidth: Uploading large amounts of video can strain connections.
Privacy: You must ensure data is anonymized or masked before it leaves the store.
Hybrid Approach: Best of Both Worlds
Many modern deployments use a hybrid setup:
Lightweight processing at the edge: to detect people, anonymize faces, and flag key events.
Cloud for heavy lifting: to run deeper analysis on anonymized snapshots or event logs.
This approach balances speed, privacy, and scalability. For example, you can blur faces on-site using an API like API4AI’s Image Anonymization API, then send only anonymized frames or JSON logs (like “shopper dwelled at shelf B for 42 seconds”) to the cloud for aggregation.
Respecting Customer Privacy and Data Regulations
No matter where you process video, privacy and compliance must be top priorities. Key steps include:
Anonymizing faces before storing or sending data.
Masking or blurring other personal identifiers.
Following retention rules — for example, deleting footage after a set number of days.
Displaying consent signage informing shoppers that camera analytics are used.
Choosing trustworthy vendors that follow industry security standards like ISO/IEC 27001.
APIs that handle anonymization, object detection, and event classification can help automate compliance and reduce manual review.
In short, your deployment strategy should reflect your store’s reality. Small shops with limited connectivity may rely on edge devices, while larger retailers benefit from the cloud’s scale. Most often, the best answer lies in a hybrid model — smart enough to protect shopper privacy, fast enough to deliver real-time insights, and flexible enough to grow with your business.

Proving ROI: From Engagement Metrics to Revenue Attribution
No technology investment makes sense unless it drives real business results. Fortunately, turning store footage into marketing insights isn’t just about cool dashboards — it directly connects to higher sales, better store performance, and smarter merchandising decisions.
The key to making this connection is to move from engagement metrics (like dwell time or pick-up rates) to financial impact (like increased sales or reduced markdowns). Let’s look at how retailers can turn camera-driven insights into a clear return on investment (ROI).
Dwell Time = Product Interest
When shoppers spend more time in front of a product or display, it usually means they’re interested. Measuring average dwell time in specific zones helps identify which areas are capturing attention — and which ones are falling flat.
Retail teams can use this data to:
Rework underperforming displays.
Test different product arrangements.
Highlight bestsellers with better signage or lighting.
Even small improvements in layout can lead to measurable increases in product visibility, which often translates into higher conversions.
Pick-Up and Put-Back: Understanding Product Appeal
Computer vision can detect when someone picks up an item, looks at it, and either keeps it or puts it back. This simple action tells you a lot:
High pick-up but low purchase? Pricing, packaging, or product messaging might need adjustment.
Low interaction altogether? The product could be misplaced, hard to see, or simply unappealing.
By tracking pick-up and put-back rates, retailers can make more informed decisions about product placement, bundling, or discounts.
Linking Engagement to Sales
To prove real ROI, it's important to link engagement data to actual transactions. While cameras don’t track purchases directly, time-based correlation can help:
If a shopper dwells at the fragrance aisle at 2:15 PM and a bottle of perfume is sold at 2:17 PM, the system logs this as a likely match.
Over time, patterns emerge — like “longer dwell times in this aisle lead to more purchases during afternoon hours.”
Retailers can compare:
Before and after layouts (e.g. “conversion went up 12% after changing shelf position”).
A/B display tests across similar stores or departments.
Sales uplift from campaigns tied to heatmap-verified high-traffic areas.
Dashboards That Finance and CX Teams Can Use
To get buy-in across departments, insights need to be presented in business-friendly terms. That means going beyond raw engagement data to include:
Conversion rate per zone (foot traffic to purchase ratio).
Gross margin per square foot (high-engagement zones often have higher value potential).
Promo effectiveness (how much engagement a campaign drove vs. how much it cost).
When these numbers are packaged into clear, visual dashboards, finance teams can track ROI, CX teams can monitor shopper behavior, and marketing teams can optimize campaigns faster.
Real-World Wins
Here are a few practical examples of ROI in action:
A beverage brand increased sales by 15% after using heatmaps to reposition coolers to high-traffic areas.
A fashion retailer reduced end-of-season markdowns by 22% after spotting which items were being ignored early on.
A drugstore chain improved promo success by 2x by targeting displays to zones where shoppers were already spending more time.
In summary, engagement metrics like dwell time, pick-up rates, and footpath heatmaps are not just interesting — they’re actionable indicators of shopper intent. When combined with sales data and store performance goals, they paint a clear picture of ROI. And with modern vision tools and APIs, retailers can start collecting and using this data without building complex systems from scratch. The result? Smarter decisions, faster results, and a measurable impact on the bottom line.

Conclusion – Cameras as Merchandising Co-Pilots
Retailers have always wanted to understand what really happens inside their stores — what catches a shopper’s eye, what leads to a sale, and what makes someone walk away. Now, thanks to modern computer vision and video analytics, those answers are finally within reach.
Cameras are no longer just silent observers or security tools. With the help of smart vision models and AI-powered APIs, they’re becoming active merchandising co-pilots — guiding layout decisions, highlighting product opportunities, and helping retailers fine-tune the in-store experience based on actual shopper behavior.
What makes this even more powerful is how accessible it’s become. You don’t need a large data science team or months of custom development. With ready-to-use solutions like:
Object Detection APIs to track product interactions,
Brand Recognition APIs to spot logos and packaging,
Image Anonymization APIs to ensure privacy compliance,
retailers can launch meaningful experiments quickly and cost-effectively.
Start small: pick one high-traffic zone in your store. Use vision tools to measure how shoppers move, where they stop, and what they interact with. Then, test a new layout or display and compare the results. You’ll be surprised how fast you can go from guesswork to insight — and from insight to impact.
In an industry where every square foot counts, video-powered analytics give you a clear competitive edge. It’s like having a live, always-on focus group walking through your store — ready to tell you what works, what doesn’t, and how to improve.
As vision technologies continue to evolve, the physical store will only get smarter. Tomorrow’s merchandising teams won’t just rely on past sales reports — they’ll design and adapt in real time, powered by the data hiding in plain sight: the video feed.
The future of retail isn’t just digital — it’s visible. And it’s already here.