From Highlights to ROI: Annotating Sponsor Moments
Introduction — Why “Goal + Logo” Moments Are the New KPI
Sponsorship teams don’t just need great highlights; they need defensible return on investment. The most valuable clips are the seconds when two things happen at once: a scoring event (goal, try, basket, point) and a sponsor logo clearly visible in the same frame. Those “goal + logo” co-occurrence moments can be auto-tagged in real time, converted into ready-made clips, and shipped with Screen Time totals embedded — so your editors publish faster and your commercial team walks into renewals with proof, not anecdotes.
Three shifts have made this possible and urgent for C-suites:
Short-form video is the default fan format. Social platforms and UGC ecosystems have reset how highlights are consumed and monetized. Boards increasingly ask if production teams are optimized for these channels, not just for full-match broadcasts (Deloitte).
Sponsorship valuation is getting more granular. Industry methodologies price on-screen exposure by duration, size, position, and clarity — so capturing the exact seconds and the quality of each appearance directly ladders into commercial value (Nielsen Sports).
What “goal + logo” tagging does for the business:
Turns highlights into invoices. When every clip carries verified Screen Time (and, optionally, quality weighting), it’s easier to justify rate cards, negotiate make-goods, and align bonuses with delivery.
Compresses time-to-social. Editors receive pre-cut, brand-sorted reels with head/tail buffers; your channels post minutes faster — while rights partners get consistent, sponsor-visible storytelling.
Creates a single source of truth. The same timecodes power social publishing, rights compliance, and executive reporting — reducing discrepancies between broadcast ops, sales, and finance.
Builds a compounding advantage. Over a season, co-occurrence data reveals which camera plans, angles, or LED zones maximize sponsor outcomes — informing creative, placement, and pricing.
How it works at a high level (no jargon): detect the event; detect and track the logo; tag the overlap down to the second; sum Screen Time and apply quality weights; auto-produce clips and a lightweight report. You can get there quickly with established computer-vision building blocks — logo recognition, object detection, and OCR — available as ready-to-use APIs or as tailored models for venue-specific edge cases (for example, using a Brand Recognition API to identify and track sponsor marks frame by frame).
Executive takeaway: highlights are no longer just creative assets. When you systematically capture goal + logo co-occurrences, you convert video into a revenue instrument: faster social reach, clearer proof of performance, and pricing power grounded in standardized exposure metrics. For context on the content shift, see Deloitte’s latest Digital Media Trends, and for how exposure is commonly valued, review Nielsen Sports’ media valuation approach.

The Business Case — From “Nice Highlights” to Commercial Proof
Sponsorship leaders don’t get budget for anecdotal buzz — they get it for measurable delivery. The commercial value of a highlight reel is unlocked when you can prove, clip by clip, how many seconds a sponsor was clearly visible at the exact moment of peak attention (e.g., a goal). That evidence turns creative assets into board-ready KPIs that support pricing, renewals, and make-goods.
What counts commercially
Screen Time (hh:mm:ss): the verified duration a logo is on screen during high-value action.
Visual Share of Voice (vSOV %): your brand’s portion of total on-screen exposure versus competitors in the same match or window.
Exposure Score: a quality weighting that multiplies duration by size, position, and clarity (e.g., center-frame, large, unobstructed receives a higher score than small, peripheral, or occluded). This mirrors widely used industry approaches to sponsorship media valuation that adjust raw time by quality factors (Nielsen Sports).
Cost per Exposure Second (CPeS): rights fee divided by verified exposure seconds — an apples-to-apples efficiency metric across matches, placements, and seasons.
Why C-suites care
Rate cards with teeth: When each clip carries embedded Screen Time and an Exposure Score, sales teams can justify premium placements (for example, center-circle LEDs) and negotiate escalators with confidence. External valuation frameworks and benchmarks reinforce these conversations and align stakeholders on “what a second is worth”.
Renewals and make-goods you can defend: Moment-level logs (goal + logo overlap) provide transparent delivery reports. If targets aren’t met, you can calculate make-goods precisely instead of relying on broad impressions.
Faster path from content to cash: Editors receive brand-sorted, pre-cut reels; social teams publish minutes faster; commercial teams attach proof links to recap decks. One workflow, multiple revenue impacts.
Season-long optimization: Aggregated co-occurrence data reveals which camera plans, angles, and LED zones maximize Exposure Score — informing creative, operations, and future pricing.
How the math shows up in the P&L
From seconds to dollars: Map Screen Time and Exposure Score to media value benchmarks (internal or external) to estimate delivered value per match and across a season. Over time, compare CPeS by asset and league to reallocate spend toward the most efficient surfaces or moments. This is consistent with how leading providers translate exposure into monetary value for sponsorship reporting (Nielsen).
Risk reduction & governance: A single, timestamped truth set reduces disputes between broadcast ops, social, sponsors, and finance — critical when six- and seven-figure decisions hinge on a handful of high-impact clips.
Where technology fits (without the jargon)
Automated logo recognition detects and tracks sponsor marks; event detection (scoreboard OCR, whistle/audio spikes, or scoreboard changes) identifies goals; the system tags the overlap seconds and auto-produces clips and summaries. You can start quickly with ready-to-use APIs (e.g., a Brand Recognition API paired with OCR and anonymization for compliance) and extend with custom logic for your venues or leagues as needs mature.
Executive takeaway: treating “goal + logo” seconds as a unit of value upgrades highlights from “nice content” to commercial proof — a defensible, repeatable, and optimizable system that boards recognize. For broader context on where the industry is heading, see Deloitte’s latest Sports Industry Outlook and Nielsen Sports’ overview of sponsorship media valuation (both are helpful starting points for aligning leadership around the KPIs you’ll standardize).
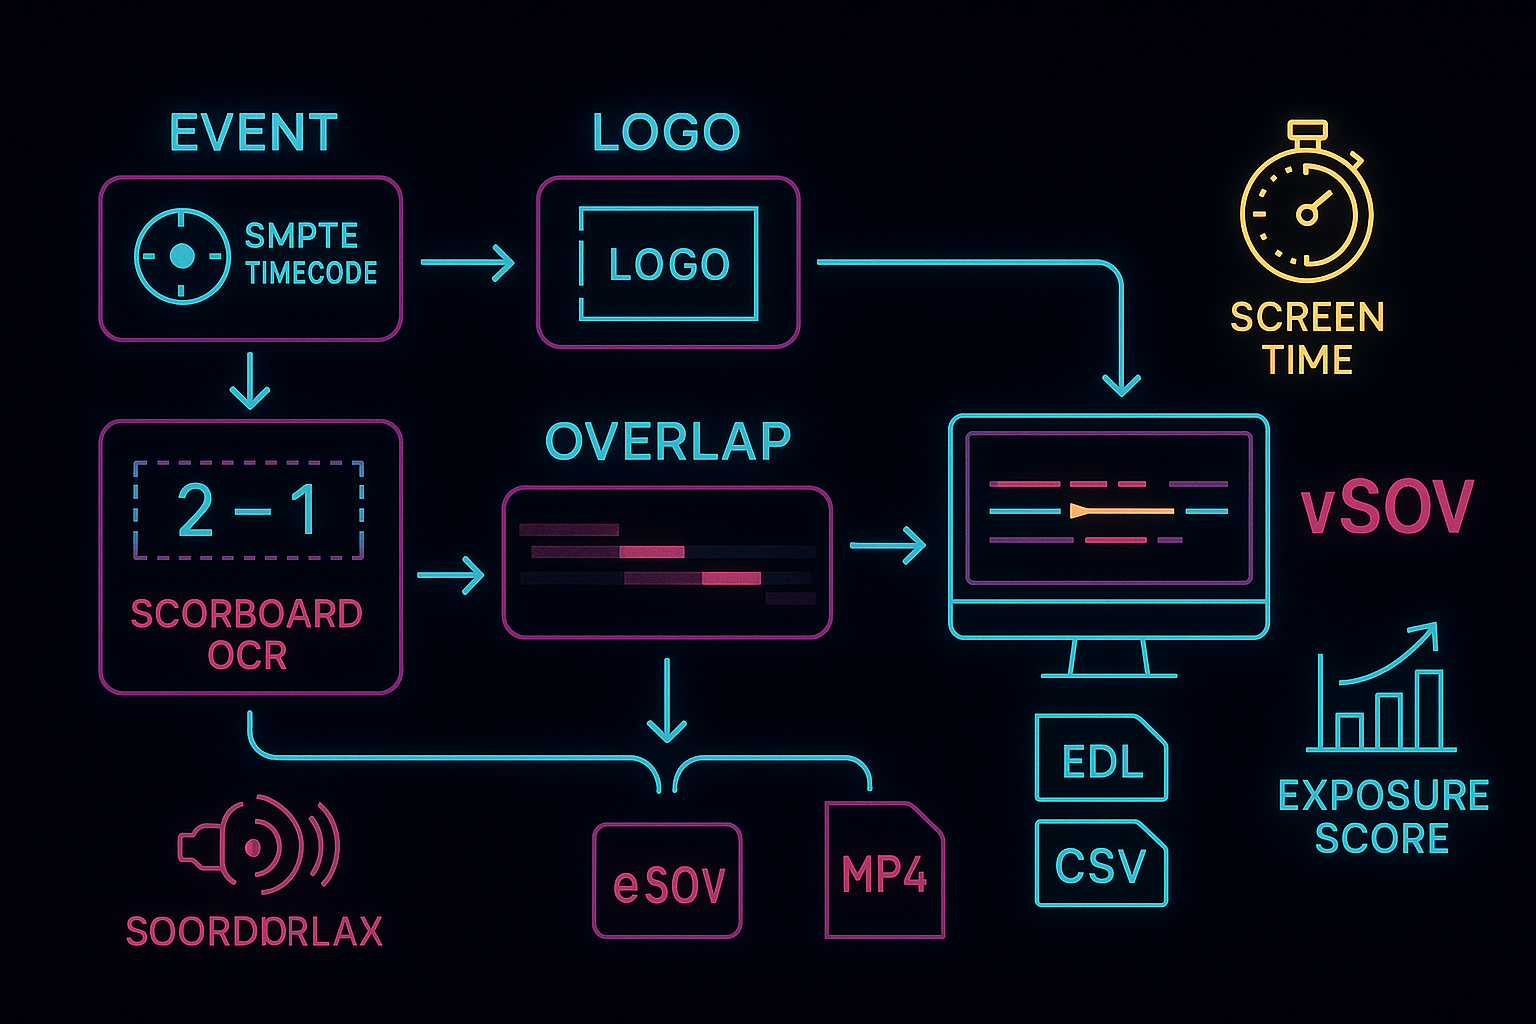
How It Works — From Detection to Ready-Made Clips (Tech, not Jargon)
Executives don’t need the math; they need a clear picture of how “goal + logo” seconds become board-ready proof — fast.
1) Sync the footage so every second is traceable.
Live feeds or VOD files are ingested and normalized (frame rate, audio, resolution). A reliable time reference — SMPTE timecode — keeps every frame addressable across cameras, graphics, and audio, so downstream decisions and exports line up exactly. This matters later when legal, sales, and finance all rely on the same timestamps. See SMPTE’s overview for a plain-English explanation of frame labeling and user bits. SMPTE
2) Detect the “moment” (the goal).
The system looks for high-value events using multiple lightweight signals so it’s robust across sports and venues:
Scoreboard OCR to spot score changes.
Audio spikes/whistles as secondary cues.
Object/action cues (ball crossing the line/hoop) if available.
Combining simple signals keeps latency low and reduces false alarms.
3) Detect and track the sponsor logo.
A logo recognition component identifies and tracks sponsor marks frame-by-frame, measuring practical quality factors executives care about: how long it’s visible (Screen Time), how large it appears (area), where it sits in frame (position), and how clear it is (occlusion/blur). This can be bootstrapped quickly with ready-to-use endpoints (e.g., a Brand Recognition API) and extended later with custom training for venue-specific LEDs or unusual camera plans.
4) Tag the overlap seconds (“goal + logo”).
A simple co-occurrence rule matches the event window (the goal) with the logo track and tags the exact seconds they share the frame. Micro-glimpses below a minimum duration or size are ignored; contiguous moments are merged so editors receive clean, human-friendly clips.
5) Score and summarize automatically.
For each moment, the system calculates:
Screen Time (hh:mm:ss) — verified seconds on screen.
Visual Share of Voice (vSOV %) — your brand’s share of total exposure that match/day.
Exposure Score — a quality-weighted figure that adjusts time by size, position, and clarity.
These metrics follow common industry practice: value time, but weight it for visual quality.
6) Hand editors finished assets — not raw footage.
For every tagged moment, the system produces ready-made clips with small head/tail buffers, plus an Edit Decision List (EDL) for NLEs and a compact JSON/CSV for BI. Editors can publish immediately; commercial teams drop metrics straight into recaps. Because clips, EDLs, and reports all use the same timestamps, you get one source of truth.
7) Build in trust and brand safety.
Confidence thresholds, occlusion checks, and brief human-in-the-loop review on top moments keep accuracy high. Image anonymization (faces/plates) supports rights and privacy when needed; NSFW checks protect sponsors if you process fan-generated content. Everything is logged with timestamps for audits, make-goods, and renewals.
8) Integrate where the work already happens.
Output flows into your MAM/DAM, cloud storage, and collaboration tools (Slack/Teams). Dashboards in your existing BI tool show Screen Time, vSOV, and Exposure Score by brand, match, and placement. Alerts can notify sales the moment a sponsor-worthy clip is available.
9) Fast pilot, then tailor for edge cases.
Most organizations start with off-the-shelf APIs (logo recognition, OCR, anonymization) to prove value in weeks, then invest in custom models where it uniquely pays off — sport-specific cues, unusual lighting, or venue-specific LED signatures. For an example of an automated highlight pipeline approach (not vendor-specific to your stack), see AWS’s reference for machine-learning highlight generation (Amazon Web Services, Inc.).
Executive takeaway: the pipeline is straightforward: detect event → detect logo → tag overlap → auto-clip → distribute with metrics. The result is quicker social reach and a defensible, standardized set of exposure numbers tied to the exact seconds that matter. Links for context: SMPTE timecode (how frames stay perfectly aligned) and a well-documented ML highlight pipeline as an architectural reference (SMPTE).

Workflow for Editors, Social & Sponsorship Teams
This is the “last-mile” where automated tagging becomes measurable impact: editors publish faster, social teams package smarter, and commercial teams walk in with proof.
For Editors: ready-to-cut, not raw footage
Receive brand-sorted moment playlists: each clip already includes head/tail buffers, the verified Screen Time, and notes on clarity (e.g., unobstructed vs. partial).
Open instantly in your NLE via EDL/XML handoff — no manual scrubbing for the right frame. If your team uses Adobe Premiere Pro, EDL export/import is standard and designed for cross-system interchange (Adobe Help Center).
Keep creative control where it matters: quick trims, add captions/graphics, color pass if needed. The heavy lift— finding the seconds where goal + logo overlap — has already been done.
Outcome: hours saved per match, fewer missed sponsor moments, consistent framing across edits.
For Social & Channels: format once, publish everywhere
Auto-generated aspect-ratio variants (9:16, 1:1, 16:9) and safe-area framing mean editors don’t re-version by hand. Instagram’s Reels guidelines, for example, reinforce the value of vertical (9:16) for mobile feeds (Instagram Help Centre).
Metadata travels with the asset: sponsor, Screen Time, Exposure Score, event, match ID — so your CMS, scheduler, or MAM/DAM can search and route clips automatically.
Faster go-live: editors hand off polished cuts to social minutes after the whistle; brand-sorted sizzles roll out by placement or partner tier.
Brand safety & compliance: optional anonymization (faces/plates) for fan footage; NSFW checks before publishing; automated captioning/subtitles for accessibility and watch-time lift.
For Sponsorship, Sales & Finance: highlight = evidence
A single source of truth: the same timestamps powering the edit handoff also drive dashboards for Screen Time, vSOV, and Exposure Score — by match, brand, and asset.
Recap in a click: export a deck or link gallery that stitches clips with their exposure metrics; include moment-level logs for audits and make-goods when targets aren’t met.
Price with confidence: compare Cost per Exposure Second (CPeS) across camera angles and LED zones; reallocate inventory to surfaces that consistently earn higher quality-weighted visibility.
CRM & rights alignment: attach proof links directly inside opportunities or renewal notes; track contractual delivery versus actuals to reduce disputes and shorten negotiation cycles.
Ops & Governance: reliability that scales
Approvals and alerts: Slack/Teams notifications when a top-tier sponsor moment is ready; light human-in-the-loop checks on flagship clips before public release.
Security & audit: SSO, role-based access, immutable logs of edits and exports; retention policies aligned to league or sponsor agreements.
Integration first: assets and reports flow into your existing MAM/DAM, cloud storage, analytics, and BI — no rip-and-replace.
What changes in the first 30 days
Time-to-publish drops from hours to minutes.
Fewer “missed” sponsor moments in social recaps.
Reps show moment-level proof in renewal decks instead of broad impressions.
Leaders see a clear map from creative output to commercial evidence — and a path to scale it across teams, venues, and leagues.
If your stack prefers another NLE or scheduling tool, the pattern is the same: detect event → detect logo → tag overlap → auto-clip → distribute with metrics. Interchange formats like EDL were built precisely to make this handoff painless for editors, and platform-specific video specs (e.g., Reels) explain why pre-baked vertical cuts are worth the extra reach.

The CFO’s Section — Metrics That Price and Prove Value
For finance leaders, the promise of automated highlights only matters if it prices, proves, and protects sponsorship revenue. The operating model is straightforward: convert seconds of verified sponsor visibility into money — consistently — so you can defend rate cards, negotiate make-goods precisely, and reallocate spend toward the most efficient placements.
From seconds to dollars (the valuation backbone)
Start with Screen Time (how long the logo is visible) and adjust it by quality factors that the market already recognizes: size in frame, position, and clarity. That quality-weighted figure — often called an Exposure Score — maps cleanly to monetary value using your media rates or independent benchmarks. This mirrors common sponsorship valuation practice, where exposure is translated into media value by combining time with on-screen prominence variables (Nielsen Sports).
Portfolio KPIs every board can track
Cost per Exposure Second (CPeS): rights fee divided by verified, quality-weighted seconds. Use it to compare assets (center-circle LEDs vs. corner boards), venues, and leagues.
Visual Share of Voice (vSOV %): the brand’s share of total on-screen exposure; a clean way to benchmark delivery against competitors or contractual targets.
Delivery vs. commitment: moment-level logs (goal + logo overlap) make make-goods mathematical — not argumentative.
Turnaround velocity: minutes from final whistle to social-ready clips; useful as a leading indicator for incremental reach and earned media.
Pricing power and renewal leverage
With goal + logo moments tagged and scored, sales teams can defend premium surfaces and camera plans using empirical evidence, not anecdotes. Clip-level metrics roll up into match and season summaries for executive decks, all supported by the same timestamps editors used to produce the content. When targets are missed, you can price make-goods at the same CPeS you used to sell the package — closing the loop transparently.
Forecasting and scenario planning
Treat exposure as an optimizer, not just a report card. Simulate alternative camera cuts, ad rotations, or LED placements and compare expected Exposure Score and vSOV before committing inventory. Over time, the dataset reveals which creative choices and angles systematically increase quality-weighted seconds, informing next season’s rate card and placement strategy.
Governance, comparability, and risk control
Adopt a written measurement policy: minimum visibility thresholds, occlusion rules, and how quality weights are applied. Align definitions with emerging attention/visibility guidance from industry bodies so your methodology stands up in procurement discussions and auditor reviews. (The IAB’s developing Attention Measurement Guidelines are a useful north star for consistent, comparable reporting across digital media and video.) IAB
Cost discipline (TCO you can actually manage)
Most teams start with ready-to-use APIs (logo recognition, OCR, anonymization) to prove value in weeks. That keeps initial spend mostly variable (processing hours, storage, bandwidth) and limits change-management risk. As patterns stabilize, consider tailored models for venue-specific LEDs or unusual broadcast conditions; this shifts part of the spend into a long-lived asset while reducing unit costs in high-volume workflows.
30-day finance checklist
Define success in advance: CPeS improvement, vSOV coverage, and time-to-publish targets for one team or venue.
Require a single, timestamped dataset shared by production, sales, and finance; no parallel spreadsheets.
Insist on clip-level evidence attached to each invoice, plus a standardized recap for the season.
Bake measurement rules into contracts (visibility thresholds, valuation method) to minimize disputes.
Executive takeaway: when you treat goal + logo seconds as a priced unit of value — weighted for prominence and backed by auditable timestamps — you turn highlights into a reliable revenue instrument. That unlocks firmer pricing, faster renewals, and cleaner make-goods, with a governance model your auditors (and partners) can endorse. For deeper context on valuation mechanics and comparability, see Nielsen Sports’ media valuation overview and the IAB’s Attention Measurement Guidelines (public draft).

Build vs. Buy — Fastest Path with Ready APIs + Tailored Pieces
For executives, the decision isn’t “custom or off-the-shelf?” — it’s time-to-impact now versus durable advantage later. The winning pattern in sports media is a hybrid: start with proven APIs to stand up the “goal + logo” pipeline in weeks; then invest selectively in custom components where you can turn venue quirks and workflows into proprietary leverage.
When to start with ready APIs (buy/assemble)
Speed & certainty: You get immediate coverage for the core building blocks — logo recognition, OCR for scoreboards, face/license-plate anonymization, basic object detection — without a research program. This supports a 30-day pilot with measurable KPIs (time-to-publish, Screen Time accuracy, CPeS).
Variable cost profile: Usage-based pricing maps spend to value; you avoid fixed GPU capacity until volumes justify it.
Lower integration risk: Mature APIs come with SDKs, monitoring, and interchange formats (EDL/CSV/JSON) that plug into your MAM/DAM, BI, and social schedulers. The biggest cost in software is often integration, not the component itself — buying mature parts reduces schedule risk and surprises (martinfowler.com).
When to add tailored pieces (build/extend)
Venue-specific realities: Unusual LED refresh, lighting, or camera plans can degrade generic models. Fine-tuning a logo/brand tracker on your footage recovers accuracy and reduces human QA minutes per match.
Latency and sovereignty: For live workflows or regulated data, you may need on-prem/edge inference with strict retention and audit trails.
Unit-economics at scale: Past a volume threshold, training a fit-for-purpose model can lower per-hour costs versus general APIs while improving precision on your classes and angles.
Defensible differentiation: Proprietary co-occurrence logic (how you weight area, position, clarity) and operator tools become part of your commercial “secret sauce.”
A phased roadmap that de-risks the decision
Pilot (weeks): Wire a thin vertical slice — detect event, detect logo, tag overlap seconds, auto-clip with head/tail buffers, publish brand-sorted reels with Screen Time baked in. Use a Brand Recognition API plus OCR/anonymization to cover the basics.
Prove value (1–2 months): Run across multiple matches. Track CPeS, vSOV, and turnaround time. Identify where accuracy or cost needs uplift.
Targeted custom (quarter): Fine-tune detectors on your venues; add sport-specific signals (e.g., scoreboard deltas + audio whistles); push inference to edge if latency or egress costs matter.
Scale & govern (season): Bake rules into contracts (visibility thresholds, method), standardize dashboards, and formalize a measurement policy so finance, legal, and partners use the same numbers.
TCO lens for the board
Near-term: APIs concentrate spend in variable OPEX (credits, storage, bandwidth) and keep delivery dates predictable.
Mid-term: Customization shifts some spend into CAPEX-like assets — trained models, pipelines — that reduce unit cost and increase accuracy on your data.
Long-term risk: ML systems accumulate technical debt (data drift, feature entanglement, retraining cadence). Budget for ongoing evaluation and model ops from day one; this is where many “build-only” efforts fail (Google Research).
Practical guardrails (avoid lock-in while moving fast)
Keep inputs/outputs in open or well-documented formats (EDL, CSV, JSON).
Separate business logic (co-occurrence rules, Exposure Score) from model providers so you can swap components without rewriting the workflow.
Centralize timestamps as the system of record to keep editors, social, and finance aligned — no parallel truths.
Instrument everything: accuracy, latency, cost per processed minute, human QA time. Let the data tell you where to invest in custom work.
How this maps to your teams
Production gets reliable, ready-made clips immediately; customizations later target the edge cases that slow editors down.
Commercial gains defensible pricing (Screen Time, vSOV, CPeS) from day one; custom weighting and venue tuning sharpen the story at renewal.
Finance/IT sees a controlled ramp: variable cost now, targeted capitalized assets later, and a clear plan to manage ML lifecycle risks.
Executive takeaway: don’t choose between speed and strategy. Assemble with ready APIs now to prove ROI on “goal + logo” seconds, then invest in tailored models where accuracy, latency, or cost curves justify it. For context on why integration dominates delivery risk, see Martin Fowler’s note on buy vs build and integration; for sustaining advantages without surprises, review Google’s paper on hidden technical debt in ML systems.
Suggested external reading:
Martin Fowler, “You Can’t Buy Integration.”
Sculley et al., “Hidden Technical Debt in Machine Learning Systems.”

Conclusion — Turn Highlights into Revenue Proof
Executives don’t fund editing workflows; they fund outcomes. When you systematically tag the exact seconds where a scoring event and a sponsor logo share the frame, highlights stop being “nice content” and become commercial evidence. You gain three compounding advantages:
Speed to market: editors receive ready-made, brand-sorted clips with Screen Time baked in — social posts ship in minutes, not hours.
Pricing power: moment-level logs, quality-weighted exposure (area × position × clarity), and CPeS let you defend rate cards and negotiate make-goods with numbers, not narratives.
Governance: one timestamped truth set aligns production, sales, finance, and legal — reducing disputes and renewing faster.
A pragmatic path forward:
Run a 30-day pilot on one team or venue. Wire a thin slice: detect the event, detect and track the logo, tag the overlap seconds, auto-clip with head/tail buffers, and publish brand-sorted reels. Define success upfront as time-to-publish, Screen Time accuracy, vSOV coverage, and CPeS improvement.
Assemble first, customize later. Start with proven, API-first building blocks (e.g., Brand Recognition API for logo detection, OCR for scoreboards, anonymization for rights compliance). Once value is proven, fine-tune models on your footage to recover accuracy in tricky lighting, LED patterns, or unusual camera plans.
Institutionalize the measurement policy. Write down visibility thresholds, occlusion rules, and how you weight size/position/clarity; make that the basis for reporting and contracts. Align with emerging industry guidance on attention and comparability to future-proof procurement discussions. IAB
Connect the dots to revenue. Map quality-weighted Screen Time to media valuation benchmarks each match and roll up by season. This is how leading sponsorship analytics frameworks translate exposure into monetary value — and how your team turns highlights into invoices. Nielsen Sports
Avoid lock-in while you scale. Keep business logic (co-occurrence rules, scoring) separate from model providers; use open interchange (EDL/CSV) and make timestamps the system of record across editing, BI, and finance.
Executive takeaway: Treat “goal + logo” seconds as a priced unit of value. Prove it fast with ready-to-use vision APIs, then invest selectively in custom components where accuracy, latency, or unit economics give you durable advantage. The result is faster social reach, clearer proof of performance, and a sponsorship engine your board can quantify and govern. For context on valuation and comparability standards, see Nielsen Sports’ media valuation overview and the IAB’s Attention Measurement Guidelines.